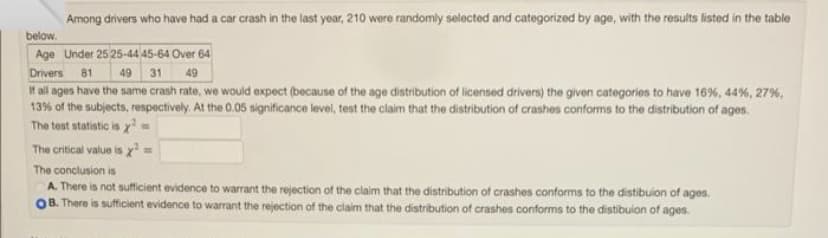
Among drivers who have had a car crash in the last year, 210 were randomly selected and categorized by age, with the results listed in the table below. Age Under 25 25-44 45-64 Over 64 Drivers 81 49 31 49 If all ages have the same crash rate, we would expect (because of the age distribution of licensed drivers) the given categories to have 16%, 44 %, 27%, 13% of the subjects, respectively. At the 0.05 significance level, test the claim that the distribution of crashes conforms to the distribution of ages. The test statistic is x² The critical value is x2= The conclusion is A. There is not sufficient evidence to warrant the rejection of the claim that the distribution of crashes conforms to the distibulon of ages. OB. There is sufficient evidence to warrant the rejection of the claim that the distribution of crashes conforms to the distibulon of ages.
Among drivers who have had a car crash in the last year, 210 were randomly selected and categorized by age, with the results listed in the table below. Age Under 25 25-44 45-64 Over 64 Drivers 81 49 31 49 If all ages have the same crash rate, we would expect (because of the age distribution of licensed drivers) the given categories to have 16%, 44 %, 27%, 13% of the subjects, respectively. At the 0.05 significance level, test the claim that the distribution of crashes conforms to the distribution of ages. The test statistic is x² The critical value is x2= The conclusion is A. There is not sufficient evidence to warrant the rejection of the claim that the distribution of crashes conforms to the distibulon of ages. OB. There is sufficient evidence to warrant the rejection of the claim that the distribution of crashes conforms to the distibulon of ages.

Glencoe Algebra 1, Student Edition, 9780079039897, 0079039898, 2018
18th Edition
ISBN:9780079039897
Author:Carter
Publisher:Carter
Chapter10: Statistics
Section10.6: Summarizing Categorical Data
Problem 10CYU

Related questions
Question
Transcribed Image Text:Among drivers who have had a car crash in the last year, 210 were randomly selected and categorized by age, with the results listed in the table
below.
Age Under 25 25-44 45-64 Over 64
Drivers 81
49 31 49
If all ages have the same crash rate, we would expect (because of the age distribution of licensed drivers) the given categories to have 16%, 44 %, 27%,
13% of the subjects, respectively. At the 0.05 significance level, test the claim that the distribution of crashes conforms to the distribution of ages.
The test statistic is x² =
The critical value is x²
The conclusion is
A. There is not sufficient evidence to warrant the rejection of the claim that the distribution of crashes conforms to the distibulon of ages.
OB. There is sufficient evidence to warrant the rejection of the claim that the distribution of crashes conforms to the distibulon of ages.
Expert Solution
This question has been solved!
Explore an expertly crafted, step-by-step solution for a thorough understanding of key concepts.

Step by step
Solved in 3 steps with 3 images

Recommended textbooks for you
Glencoe Algebra 1, Student Edition, 9780079039897…
Algebra
ISBN:
9780079039897
Author:
Carter
Publisher:
McGraw Hill

Holt Mcdougal Larson Pre-algebra: Student Edition…
Algebra
ISBN:
9780547587776
Author:
HOLT MCDOUGAL
Publisher:
HOLT MCDOUGAL

College Algebra (MindTap Course List)
Algebra
ISBN:
9781305652231
Author:
R. David Gustafson, Jeff Hughes
Publisher:
Cengage Learning
Glencoe Algebra 1, Student Edition, 9780079039897…
Algebra
ISBN:
9780079039897
Author:
Carter
Publisher:
McGraw Hill
Holt Mcdougal Larson Pre-algebra: Student Edition…
Algebra
ISBN:
9780547587776
Author:
HOLT MCDOUGAL
Publisher:
HOLT MCDOUGAL
College Algebra (MindTap Course List)
Algebra
ISBN:
9781305652231
Author:
R. David Gustafson, Jeff Hughes
Publisher:
Cengage Learning