Analyze the economic forecast data for the three countries. Which country has the most challenging economic environment, and why? A. Brazil has the most challenging economic environment due to its relatively low GDP growth, coupled with the highest unemployment rate among the options. B. The United Kingdom has the most challenging economic environment because their inflation rate is anticipated to undergo the most significant decrease among the options. C. The United States has the most challenging economic environment due to having the lowest inflation rate among the options.
Analyze the economic forecast data for the three countries. Which country has the most challenging economic environment, and why? A. Brazil has the most challenging economic environment due to its relatively low GDP growth, coupled with the highest unemployment rate among the options. B. The United Kingdom has the most challenging economic environment because their inflation rate is anticipated to undergo the most significant decrease among the options. C. The United States has the most challenging economic environment due to having the lowest inflation rate among the options.

ChapterA: Working With Diagrams
Section: Chapter Questions
Problem 1QP

Related questions
Question
Analyze the economic
A. Brazil has the most challenging economic environment due to its relatively low
B. The United Kingdom has the most challenging economic environment because their inflation rate is anticipated to undergo the most significant decrease among the options.
C. The United States has the most challenging economic environment due to having the lowest inflation rate among the options.
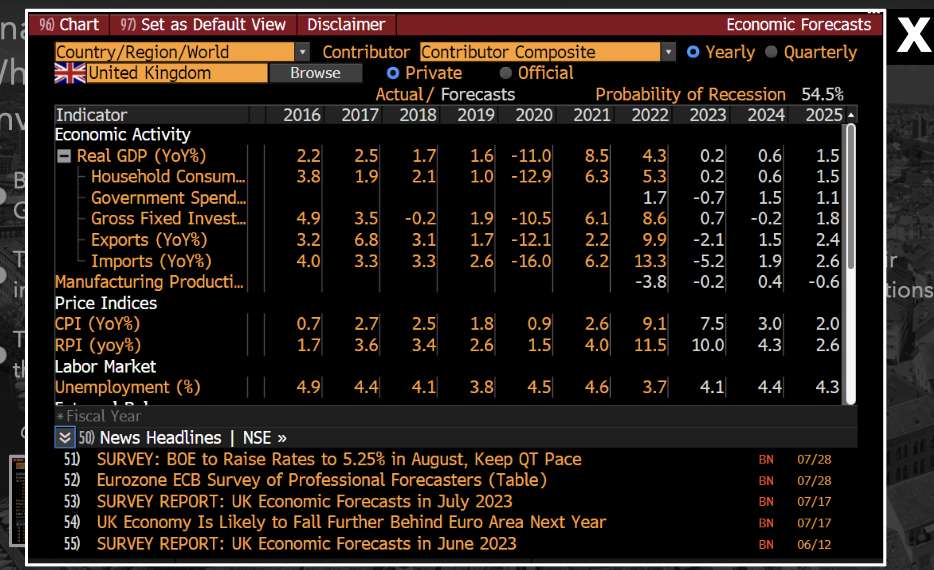
Transcribed Image Text:na 96) Chart 97) Set as Default View Disclaimer
Country/Region/World
United Kingdom
ny
B
T
t
THA
Indicator
Economic Activity
Real GDP (YoY%)
Household Consum....
Government Spend....
Gross Fixed Invest...
Exports (YoY%)
Imports (YoY%)
Manufacturing Producti...
Price Indices
CPI (YOY%)
RPI (yoy %)
Labor Market
Unemployment (%)
Contributor Contributor Composite
o Private ● Official
Actual/ Forecasts
Probability of Recession 54.5%
2016 2017 2018 2019 2020 2021 2022 2023 2024 2025
Browse
2.2 2.5
3.8 1.9
1.7
2.1
4.9 3.5 -0.2
6.8
4.0 3.3
3.2
3.1
0.7
1.7
1.6 -11.0
1.0 -12.9
1.9 -10.5
1.7 -12.1
3.3 2.6 -16.0
2.7 2.5
1.8 0.9
3.6 3.4 2.6 1.5
4.9 4.4 4.1 3.8 4.5
8.5
6.3
4.3 0.2 0.6
5.3
0.2 0.6
1.7
-0.7
1.5
6.1
8.6
0.7 -0.2
2.2
9.9
-2.1
1.5
6.2 13.3 -5.2
1.9
-3.8
-0.2
0.4
2.6
4.0
Economic Forecasts X
Yearly Quarterly
4.6
Fiscal Year
50) News Headlines | NSE >>
51) SURVEY: BOE to Raise Rates to 5.25% in August, Keep QT Pace
52) Eurozone ECB Survey of Professional Forecasters (Table)
53) SURVEY REPORT: UK Economic Forecasts in July 2023
54) UK Economy Is Likely to Fall Further Behind Euro Area Next Year
55) SURVEY REPORT: UK Economic Forecasts in June 2023
9.1
7.5
3.0
11.5 10.0 4.3
3.7
4.1
4.4
BN
BN
BN
BN
BN
1.5
1.5
1.1
1.8
2.4
2.6
-0.6
2.0
2.6
4.3
07/28
07/28
07/17
07/17
06/12
tions
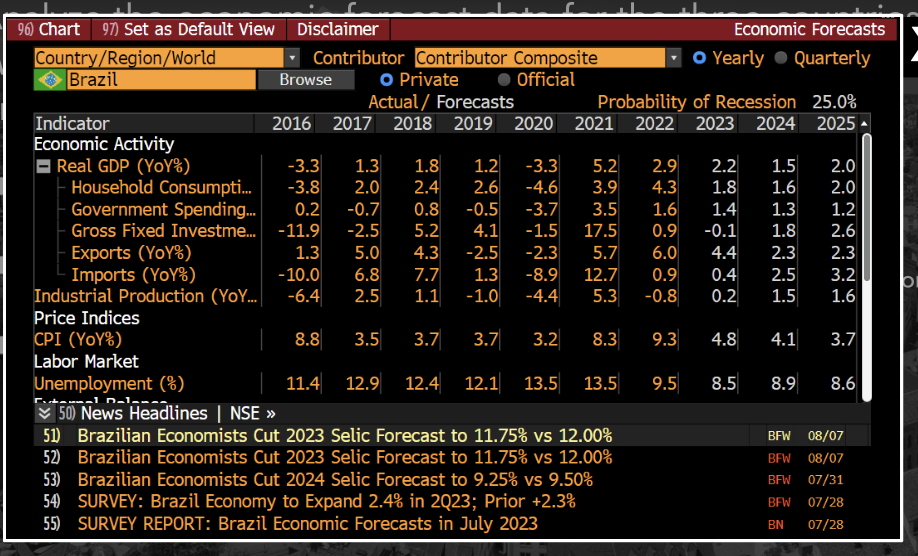
Transcribed Image Text:96) Chart 97) Set as Default View Disclaimer
Country/Region/World
Brazil
Indicator
Economic Activity
Real GDP (YoY%)
Household Consumpti...
Government Spending...
Gross Fixed Investme...
Exports (YoY%)
Imports (YoY%)
Industrial Production (YoY...
Price Indices
CPI (YOY%)
Labor Market
Unemployment (%)
Contributor Contributor Composite
o Private ● Official
Actual/ Forecasts
Probability of Recession 25.0%
2016 2017 2018 2019 2020 2021 2022 2023 2024 2025-
Browse
-3.3 1.3
-3.8 2.0
0.2 -0.7
-2.5
-11.9
1.3
-10.0
-6.4
1.8 1.2
2.4
0.8 -0.5
5.2 4.1
5.0 4.3 -2.5
6.8 7.7
2.5
1.1 -1.0
-3.3 5.2 2.9 2.2 1.5 2.0
2.6 -4.6 3.9 4.3 1.8
1.6
2.0
1.4
1.3 1.2
-3.7
-1.5
-0.1
-2.3 5.7 6.0 4.4 2.3
3.5 1.6
17.5 0.9
1.8
2.6
0.9 0.4
2.5
-0.8
0.2
1.5
1.3 -8.9 12.7
-4.4
5.3
8.8 3.5 3.7 3.7 3.2
11.4 12.9 12.4 12.1 13.5 13.5
8.3
50) News Headlines | NSE >>
51) Brazilian Economists Cut 2023 Selic Forecast to 11.75% vs 12.00%
52) Brazilian Economists Cut 2023 Selic Forecast to 11.75% vs 12.00%
53) Brazilian Economists Cut 2024 Selic Forecast to 9.25% vs 9.50%
54) SURVEY: Brazil Economy to Expand 2.4% in 2Q23; Prior +2.3%
55) SURVEY REPORT: Brazil Economic Forecasts in July 2023
Economic Forecasts
O Yearly Quarterly
9.3
9.5
4.8 4.1
8.5 8.9
NN
NN
2.3
3.2
1.6
3.7
8.6
BFW 08/07
BFW
08/07
BFW 07/31
BFW 07/28
BN 07/28
Expert Solution
This question has been solved!
Explore an expertly crafted, step-by-step solution for a thorough understanding of key concepts.

This is a popular solution!

Trending now
This is a popular solution!

Step by step
Solved in 4 steps

Knowledge Booster


Learn more about
Need a deep-dive on the concept behind this application? Look no further. Learn more about this topic, economics and related others by exploring similar questions and additional content below.Recommended textbooks for you


