Answer for Question 2, Parts A, B, and C.

Glencoe Algebra 1, Student Edition, 9780079039897, 0079039898, 2018
18th Edition
ISBN:9780079039897
Author:Carter
Publisher:Carter
Chapter10: Statistics
Section10.6: Summarizing Categorical Data
Problem 23PPS

Related questions
Question
Answer for Question 2, Parts A, B, and C.
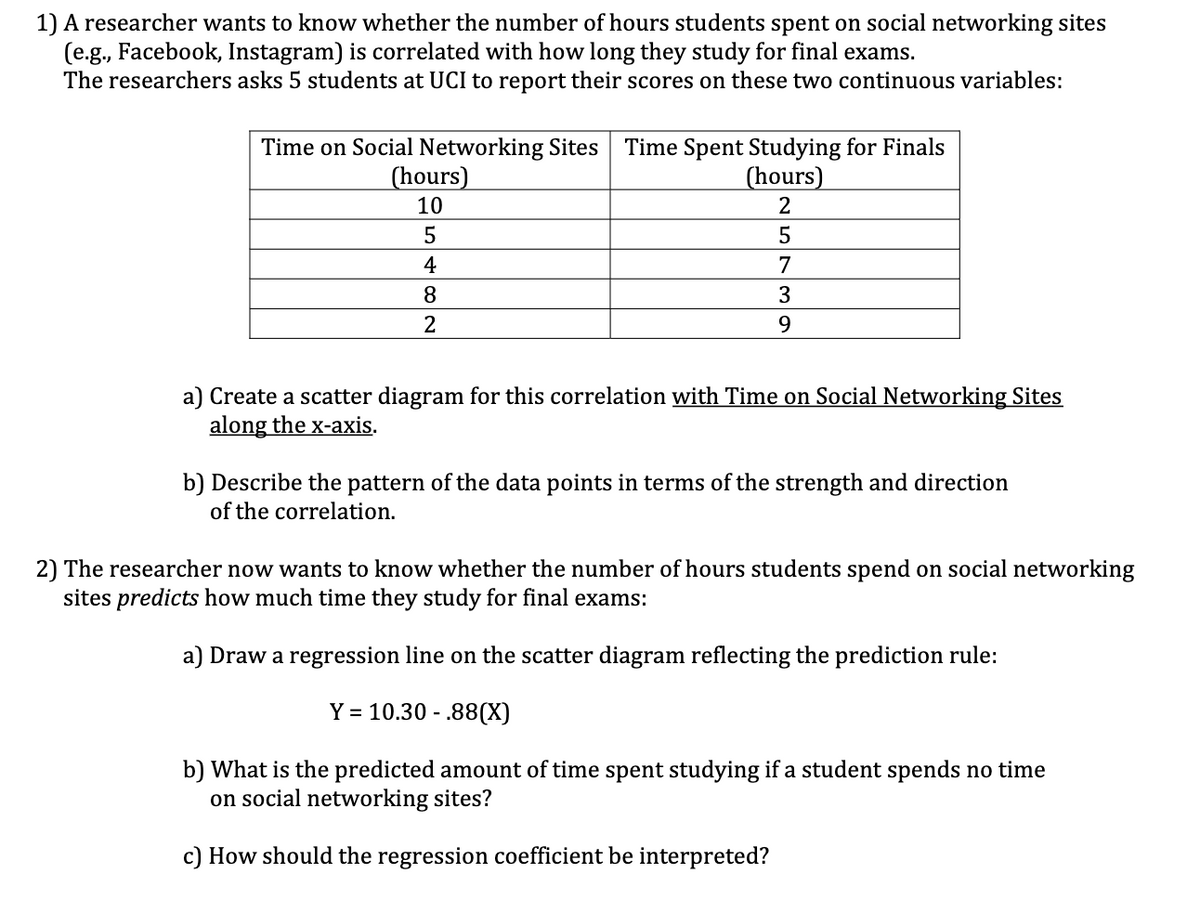
Transcribed Image Text:1) A researcher wants to know whether the number of hours students spent on social networking sites
(e.g., Facebook, Instagram) is correlated with how long they study for final exams.
The researchers asks 5 students at UCI to report their scores on these two continuous variables:
Time on Social Networking Sites Time Spent Studying for Finals
(hours)
2
5
7
3
9
(hours)
10
5
4
8
a) Create a scatter diagram for this correlation with Time on Social Networking Sites
along the x-axis.
b) Describe the pattern of the data points in terms of the strength and direction
of the correlation.
2) The researcher now wants to know whether the number of hours students spend on social networking
sites predicts how much time they study for final exams:
a) Draw a regression line on the scatter diagram reflecting the prediction rule:
Y = 10.30.88(X)
b) What is the predicted amount of time spent studying if a student spends no time
on social networking sites?
c) How should the regression coefficient be interpreted?
Expert Solution
This question has been solved!
Explore an expertly crafted, step-by-step solution for a thorough understanding of key concepts.

This is a popular solution!

Trending now
This is a popular solution!

Step by step
Solved in 4 steps with 3 images

Recommended textbooks for you
Glencoe Algebra 1, Student Edition, 9780079039897…
Algebra
ISBN:
9780079039897
Author:
Carter
Publisher:
McGraw Hill

Big Ideas Math A Bridge To Success Algebra 1: Stu…
Algebra
ISBN:
9781680331141
Author:
HOUGHTON MIFFLIN HARCOURT
Publisher:
Houghton Mifflin Harcourt
Glencoe Algebra 1, Student Edition, 9780079039897…
Algebra
ISBN:
9780079039897
Author:
Carter
Publisher:
McGraw Hill
Big Ideas Math A Bridge To Success Algebra 1: Stu…
Algebra
ISBN:
9781680331141
Author:
HOUGHTON MIFFLIN HARCOURT
Publisher:
Houghton Mifflin Harcourt