As we've previously seen, equations describing situations often contain uncertain parameters, that is, parameters that aren't necessarily a single value but instead are associated with a probability distribution function. When more than one of the variables is unknown, the outcome is difficult to visualize. A common way to overcome this difficulty is to simulate the scenario many times and count the number of times different ranges of outcomes occur. One such popular simulation is called a Monte Carlo Simulation. In this problem-solving exercise you will develop a program that will perform a Monte Carlo simulation on a simple profit function. Consider the following total profit function: PT=nPy Where Pr is the total profit, n is the number of vehicles sold and P, is the profit per vehicle. PART A Compute 5 iterations of a Monte Carlo simulation given the following information: n follows a uniform distribution with minimum of 1 and maximum 10 P, follows a normal distribution with a mean of $8125 and a standard deviation of $1275 Number of bins: 10 i.) ii.) PROBLEM-SOLVING EXERCISE #4 Recall that for all practical purposes we will use 3 std. deviations from the mean as the maximum value for parameters following a normal distribution. Obviously, 5 iterations are not very many. In fact, typically you would simulate 10,000 iterations or so to view meaningful results but I figured that I'd give you a break Ⓒ. SIMULATION Parameter n Py PT Bin # $ Range iii.) 1: 6: What are the ranges for the 10 bins? Fill in the table below: Iteration 1 6 $8000 Iteration 2 8 $9100 Iteration 3 2 $2175 Fill in the frequency of occurrences of each bin: 2: 7: 3: 8: 4: 9: Iteration 4 5 $7875 Iteration 5 7 $3175 5: 10:
As we've previously seen, equations describing situations often contain uncertain parameters, that is, parameters that aren't necessarily a single value but instead are associated with a probability distribution function. When more than one of the variables is unknown, the outcome is difficult to visualize. A common way to overcome this difficulty is to simulate the scenario many times and count the number of times different ranges of outcomes occur. One such popular simulation is called a Monte Carlo Simulation. In this problem-solving exercise you will develop a program that will perform a Monte Carlo simulation on a simple profit function. Consider the following total profit function: PT=nPy Where Pr is the total profit, n is the number of vehicles sold and P, is the profit per vehicle. PART A Compute 5 iterations of a Monte Carlo simulation given the following information: n follows a uniform distribution with minimum of 1 and maximum 10 P, follows a normal distribution with a mean of $8125 and a standard deviation of $1275 Number of bins: 10 i.) ii.) PROBLEM-SOLVING EXERCISE #4 Recall that for all practical purposes we will use 3 std. deviations from the mean as the maximum value for parameters following a normal distribution. Obviously, 5 iterations are not very many. In fact, typically you would simulate 10,000 iterations or so to view meaningful results but I figured that I'd give you a break Ⓒ. SIMULATION Parameter n Py PT Bin # $ Range iii.) 1: 6: What are the ranges for the 10 bins? Fill in the table below: Iteration 1 6 $8000 Iteration 2 8 $9100 Iteration 3 2 $2175 Fill in the frequency of occurrences of each bin: 2: 7: 3: 8: 4: 9: Iteration 4 5 $7875 Iteration 5 7 $3175 5: 10:

Database System Concepts
7th Edition
ISBN:9780078022159
Author:Abraham Silberschatz Professor, Henry F. Korth, S. Sudarshan
Publisher:Abraham Silberschatz Professor, Henry F. Korth, S. Sudarshan
Chapter1: Introduction
Section: Chapter Questions
Problem 1PE

Related questions

Question
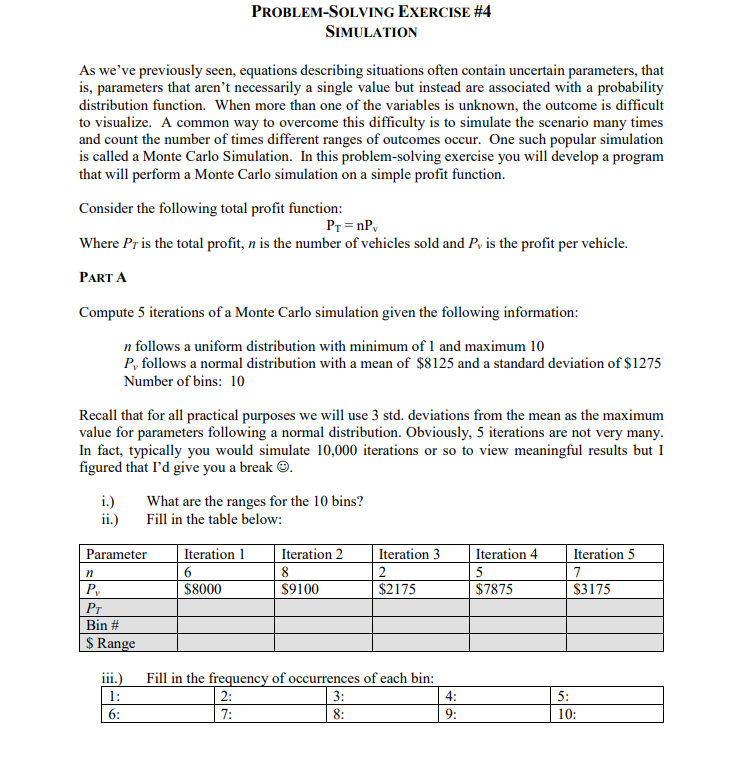
Transcribed Image Text:As we've previously seen, equations describing situations often contain uncertain parameters, that
is, parameters that aren't necessarily a single value but instead are associated with a probability
distribution function. When more than one of the variables is unknown, the outcome is difficult
to visualize. A common way to overcome this difficulty is to simulate the scenario many times
and count the number of times different ranges of outcomes occur. One such popular simulation
is called a Monte Carlo Simulation. In this problem-solving exercise you will develop a program
that will perform a Monte Carlo simulation on a simple profit function.
Consider the following total profit function:
PT=nPv
Where Pr is the total profit, n is the number of vehicles sold and P, is the profit per vehicle.
PART A
Compute 5 iterations of a Monte Carlo simulation given the following information:
n follows a uniform distribution with minimum of 1 and maximum 10
P, follows a normal distribution with a mean of $8125 and a standard deviation of $1275
Number of bins: 10
i.)
ii.)
Parameter
Recall that for all practical purposes we will use 3 std. deviations from the mean as the maximum
value for parameters following a normal distribution. Obviously, 5 iterations are not very many.
In fact, typically you would simulate 10,000 iterations or so to view meaningful results but I
figured that I'd give you a break Ⓒ.
n
Py
PROBLEM-SOLVING EXERCISE #4
PT
Bin #
$ Range
SIMULATION
iii.)
1:
6:
Iteration 1
What are the ranges for the 10 bins?
Fill in the table below:
$8000
Iteration 2
8
$9100
Iteration 3
$2175
Fill in the frequency of occurrences of each bin:
2:
3:
7:
8:
4:
9:
Iteration 4
$7875
5:
Iteration 5
7
$3175
10:
Expert Solution
This question has been solved!
Explore an expertly crafted, step-by-step solution for a thorough understanding of key concepts.

This is a popular solution!

Trending now
This is a popular solution!

Step by step
Solved in 6 steps with 2 images

Follow-up Questions
Read through expert solutions to related follow-up questions below.
Follow-up Question

Transcribed Image Text:PART B
Write the following three methods and include in the Part D code listing:
public int GetRandomUniform(int min, int max)
This method returns a random number from a uniform distribution between min and max.
public double GetRandomNormal(double mean, double stddev)
This method returns a random number from a normal distribution with a mean of mean and standard
deviation of stddev
public int GetBinIndex(double mini, double maxi, int numbins, double valuetobin)
This method returns the Bin Index given an input minimum of mini, input maximum of maxi,
numbins number of bins, and a value to bin of valuetobin
PART C
Include the methods created in part B to develop a Visual C# .NET program that will simulate the
basic profit calculation, PT = nPv, where n follows a uniform distribution, P, follows a normal
distribution, and the user can input the number of bins and number of iterations. The user must
also input the min and max for n and the mean and standard deviation for Py. Finally, the user can
click a button and the results will be graphed on a bar chart using the Microsoft Chart Control and
the average total profit (PT) will be displayed in a textbox. Turn in a screen shot of the resulting
chart using:
1. Iterations: 10000 Bins: 5
2. Iterations: 10000 Bins: 10
3. Iterations: 10000 Bins: 10
That's three screen shots.
PART D
n-min: 1
n-min: 1
n-min: 1
n-max: 10
n-max: 10
n-max: 10
P-mean: 8250 Py-stddev: 1780
Py-mean: 8250 Py-stddev: 1780
P-mean: 5500
P-stddev: 1200
Extend the Visual C# .NET program developed in part C to simulate the basic profit calculation,
Pr=nPv, where the user can select either a uniform or normal distribution for n using radio buttons
and then must input the appropriate parameters (min and max if they select uniform, mean and
standard deviation if they select normal) and they can similarly select either a uniform or normal
distribution for P, with appropriate parameters depending on the selection. Of course, the user
will input the number of bins and number of iterations. Finally, the user can click a button and the
results will be graphed on a bar chart using the Microsoft Chart Control and the average total profit
(PT) will be displayed in a textbox. Also include in the program any necessary input validation for
all input values. Turn in a listing of the code and a screen shot of the resulting chart using:
1. Iterations: 10000 Bins: 5
2. Iterations: 10000 Bins: 10
n-min: 2
n-mean: 7
n- mean: 12
3. Iterations: 10000 Bins: 10
That's three screen shots and a listing of the code.
n-max: 10 P-mean: 7250
n-stddev: 2 P-min: 1250
n- stddev: 3
Py-min: 2375
P-stddev: 1950
P-max: 6500
Py-max: 5450
Solution
Knowledge Booster


Learn more about
Need a deep-dive on the concept behind this application? Look no further. Learn more about this topic, computer-science and related others by exploring similar questions and additional content below.Recommended textbooks for you
Database System Concepts
Computer Science
ISBN:
9780078022159
Author:
Abraham Silberschatz Professor, Henry F. Korth, S. Sudarshan
Publisher:
McGraw-Hill Education

Starting Out with Python (4th Edition)
Computer Science
ISBN:
9780134444321
Author:
Tony Gaddis
Publisher:
PEARSON

Digital Fundamentals (11th Edition)
Computer Science
ISBN:
9780132737968
Author:
Thomas L. Floyd
Publisher:
PEARSON
Database System Concepts
Computer Science
ISBN:
9780078022159
Author:
Abraham Silberschatz Professor, Henry F. Korth, S. Sudarshan
Publisher:
McGraw-Hill Education
Starting Out with Python (4th Edition)
Computer Science
ISBN:
9780134444321
Author:
Tony Gaddis
Publisher:
PEARSON
Digital Fundamentals (11th Edition)
Computer Science
ISBN:
9780132737968
Author:
Thomas L. Floyd
Publisher:
PEARSON

C How to Program (8th Edition)
Computer Science
ISBN:
9780133976892
Author:
Paul J. Deitel, Harvey Deitel
Publisher:
PEARSON

Database Systems: Design, Implementation, & Manag…
Computer Science
ISBN:
9781337627900
Author:
Carlos Coronel, Steven Morris
Publisher:
Cengage Learning

Programmable Logic Controllers
Computer Science
ISBN:
9780073373843
Author:
Frank D. Petruzella
Publisher:
McGraw-Hill Education