Association for the Advancement of Science. Reprinted with permission from AAAS. FIGURE 6.13 16- 16 15- 15 The measured force versus distance curve is shown for the P5abcAA form of RNA. The black trace represents the stretching of the molecule, and the red curve repre- sents the refolding of the molecule as the beads are brought back to their original separation. The left panel shows data for an increase in force of 1 pN s¹, and the right panel shows the corresponding results for 10 pN s™¹. 14- 14 13- 13 12 12 Source: Figures 1 and 2 from "Reversible Unfolding of Single RNA Molecules by Mechanical Force" by Jan Liphardt, et al., in Science 27, Vol. 292 No. 5517: 733-737, April 2001. Copyright © 2001, The American Association for the Advancement of Science. Reprinted with permission from AAAS. 10 pN s-1 1 pN s-1 The paper shows force vs distance curves of RNA unfolding and refolding (reproduced above). What is the difference between these two curves? In nature, do you think that the forces acting or molecules would yield a graph like the one on the left, or on the right? Explain why. 220 Extension (nm) 240 260 280 220 Extension (nm) 240 260 280
Association for the Advancement of Science. Reprinted with permission from AAAS. FIGURE 6.13 16- 16 15- 15 The measured force versus distance curve is shown for the P5abcAA form of RNA. The black trace represents the stretching of the molecule, and the red curve repre- sents the refolding of the molecule as the beads are brought back to their original separation. The left panel shows data for an increase in force of 1 pN s¹, and the right panel shows the corresponding results for 10 pN s™¹. 14- 14 13- 13 12 12 Source: Figures 1 and 2 from "Reversible Unfolding of Single RNA Molecules by Mechanical Force" by Jan Liphardt, et al., in Science 27, Vol. 292 No. 5517: 733-737, April 2001. Copyright © 2001, The American Association for the Advancement of Science. Reprinted with permission from AAAS. 10 pN s-1 1 pN s-1 The paper shows force vs distance curves of RNA unfolding and refolding (reproduced above). What is the difference between these two curves? In nature, do you think that the forces acting or molecules would yield a graph like the one on the left, or on the right? Explain why. 220 Extension (nm) 240 260 280 220 Extension (nm) 240 260 280

Biochemistry
6th Edition
ISBN:9781305577206
Author:Reginald H. Garrett, Charles M. Grisham
Publisher:Reginald H. Garrett, Charles M. Grisham
Chapter29: Transcription And The Regulation Of Gene Expression
Section: Chapter Questions
Problem 16P

Related questions
Question
5. Explain why a “sawtooth” pattern is observed in the force-extension curves, versus the single
peak graph for the RNA molecule in Figure.
Transcribed Image Text:Association for the Aqvancement 0I Science.
Extension (nm)
Extension (nm)
Reprinted with permission from AAAS.
220
240
260
280
220
240
260
280
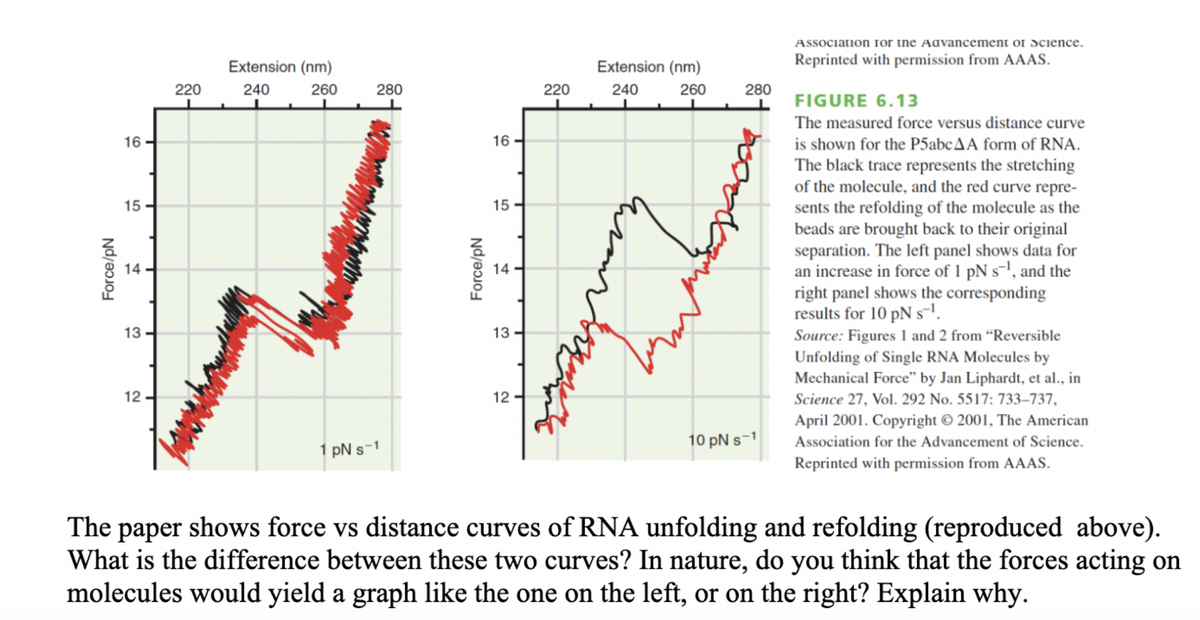
FIGURE 6.13
The measured force versus distance curve
16
16
is shown for the P5abcAA form of RNA.
The black trace represents the stretching
of the molecule, and the red curve repre-
sents the refolding of the molecule as the
beads are brought back to their original
separation. The left panel shows data for
an increase in force of 1 pN s-1, and the
right panel shows the corresponding
results for 10 pN s.
Source: Figures 1 and 2 from “Reversible
Unfolding of Single RNA Molecules by
Mechanical Force" by Jan Liphardt, et al., in
15
15
14
14
13
13 -
12
12
Science 27, Vol. 292 No. 5517: 733–737,
April 2001. Copyright © 2001, The American
10 pN s-1
Association for the Advancement of Science.
1 pN s-1
Reprinted with permission from AAAS.
The paper shows force vs distance curves of RNA unfolding and refolding (reproduced above).
What is the difference between these two curves? In nature, do you think that the forces acting on
molecules would yield a graph like the one on the left, or on the right? Explain why.
Force/pN
Force/pN
Expert Solution
This question has been solved!
Explore an expertly crafted, step-by-step solution for a thorough understanding of key concepts.

Step by step
Solved in 2 steps

Recommended textbooks for you
Biochemistry
Biochemistry
ISBN:
9781305577206
Author:
Reginald H. Garrett, Charles M. Grisham
Publisher:
Cengage Learning

Biology: The Unity and Diversity of Life (MindTap…
Biology
ISBN:
9781337408332
Author:
Cecie Starr, Ralph Taggart, Christine Evers, Lisa Starr
Publisher:
Cengage Learning
Biochemistry
Biochemistry
ISBN:
9781305577206
Author:
Reginald H. Garrett, Charles M. Grisham
Publisher:
Cengage Learning
Biology: The Unity and Diversity of Life (MindTap…
Biology
ISBN:
9781337408332
Author:
Cecie Starr, Ralph Taggart, Christine Evers, Lisa Starr
Publisher:
Cengage Learning