Based on the sample data of four different brands of chocolate chip cookies, it is desired to test whether there is a significant difference in the number of calories for the suggested servings of each brand at a significance level of 0.05 (a = 0.05). BRAND A 229 118 246 193 153 247 BRAND B 200 124 223 129 137 211 ANSWER EVERYTHING USE MEGASTAT ADD-IN IN EXCEL. SHOW THE SCREENSHOTS AND STEP BY STEP WORK I WILL UPVOTE BRAND C 117 80 v. Show the rankings of your data (if applicable). vi. Make a decision and give a conclusion. 141 113 186 159 i. State what type of nonparametric test is to be used and explain why ii. State the null hypothesis. iii. Show how data was placed in Excel. iv. Show your results with the p-value boxed in red. BRAND D 128 110 162 180 350 141
Based on the sample data of four different brands of chocolate chip cookies, it is desired to test whether there is a significant difference in the number of calories for the suggested servings of each brand at a significance level of 0.05 (a = 0.05). BRAND A 229 118 246 193 153 247 BRAND B 200 124 223 129 137 211 ANSWER EVERYTHING USE MEGASTAT ADD-IN IN EXCEL. SHOW THE SCREENSHOTS AND STEP BY STEP WORK I WILL UPVOTE BRAND C 117 80 v. Show the rankings of your data (if applicable). vi. Make a decision and give a conclusion. 141 113 186 159 i. State what type of nonparametric test is to be used and explain why ii. State the null hypothesis. iii. Show how data was placed in Excel. iv. Show your results with the p-value boxed in red. BRAND D 128 110 162 180 350 141

MATLAB: An Introduction with Applications
6th Edition
ISBN:9781119256830
Author:Amos Gilat
Publisher:Amos Gilat
Chapter1: Starting With Matlab
Section: Chapter Questions
Problem 1P

Related questions
Question
100%
use excel please and megastat
show screenshots
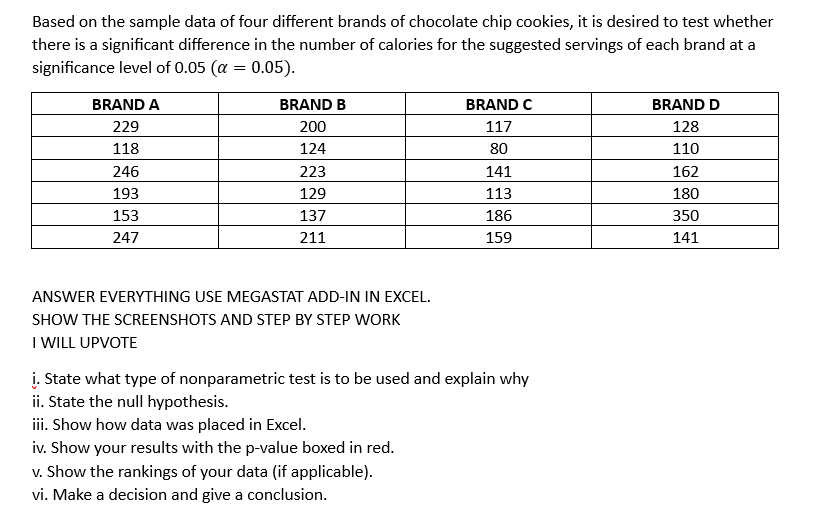
Transcribed Image Text:Based on the sample data of four different brands of chocolate chip cookies, it is desired to test whether
there is a significant difference in the number of calories for the suggested servings of each brand at a
significance level of 0.05 (α = 0.05).
BRAND A
229
118
246
193
153
247
BRAND B
200
124
223
129
137
211
ANSWER EVERYTHING USE MEGASTAT ADD-IN IN EXCEL.
SHOW THE SCREENSHOTS AND STEP BY STEP WORK
I WILL UPVOTE
BRAND C
117
80
141
113
186
159
į. State what type of nonparametric test is to be used and explain why
ii. State the null hypothesis.
iii. Show how data was placed in Excel.
iv. Show your results with the p-value boxed in red.
v. Show the rankings of your data (if applicable).
vi. Make a decision and give a conclusion.
BRAND D
128
110
162
180
350
141
Expert Solution
This question has been solved!
Explore an expertly crafted, step-by-step solution for a thorough understanding of key concepts.

Step by step
Solved in 4 steps with 6 images

Recommended textbooks for you
MATLAB: An Introduction with Applications
Statistics
ISBN:
9781119256830
Author:
Amos Gilat
Publisher:
John Wiley & Sons Inc

Probability and Statistics for Engineering and th…
Statistics
ISBN:
9781305251809
Author:
Jay L. Devore
Publisher:
Cengage Learning

Statistics for The Behavioral Sciences (MindTap C…
Statistics
ISBN:
9781305504912
Author:
Frederick J Gravetter, Larry B. Wallnau
Publisher:
Cengage Learning
MATLAB: An Introduction with Applications
Statistics
ISBN:
9781119256830
Author:
Amos Gilat
Publisher:
John Wiley & Sons Inc
Probability and Statistics for Engineering and th…
Statistics
ISBN:
9781305251809
Author:
Jay L. Devore
Publisher:
Cengage Learning
Statistics for The Behavioral Sciences (MindTap C…
Statistics
ISBN:
9781305504912
Author:
Frederick J Gravetter, Larry B. Wallnau
Publisher:
Cengage Learning

Elementary Statistics: Picturing the World (7th E…
Statistics
ISBN:
9780134683416
Author:
Ron Larson, Betsy Farber
Publisher:
PEARSON

The Basic Practice of Statistics
Statistics
ISBN:
9781319042578
Author:
David S. Moore, William I. Notz, Michael A. Fligner
Publisher:
W. H. Freeman

Introduction to the Practice of Statistics
Statistics
ISBN:
9781319013387
Author:
David S. Moore, George P. McCabe, Bruce A. Craig
Publisher:
W. H. Freeman