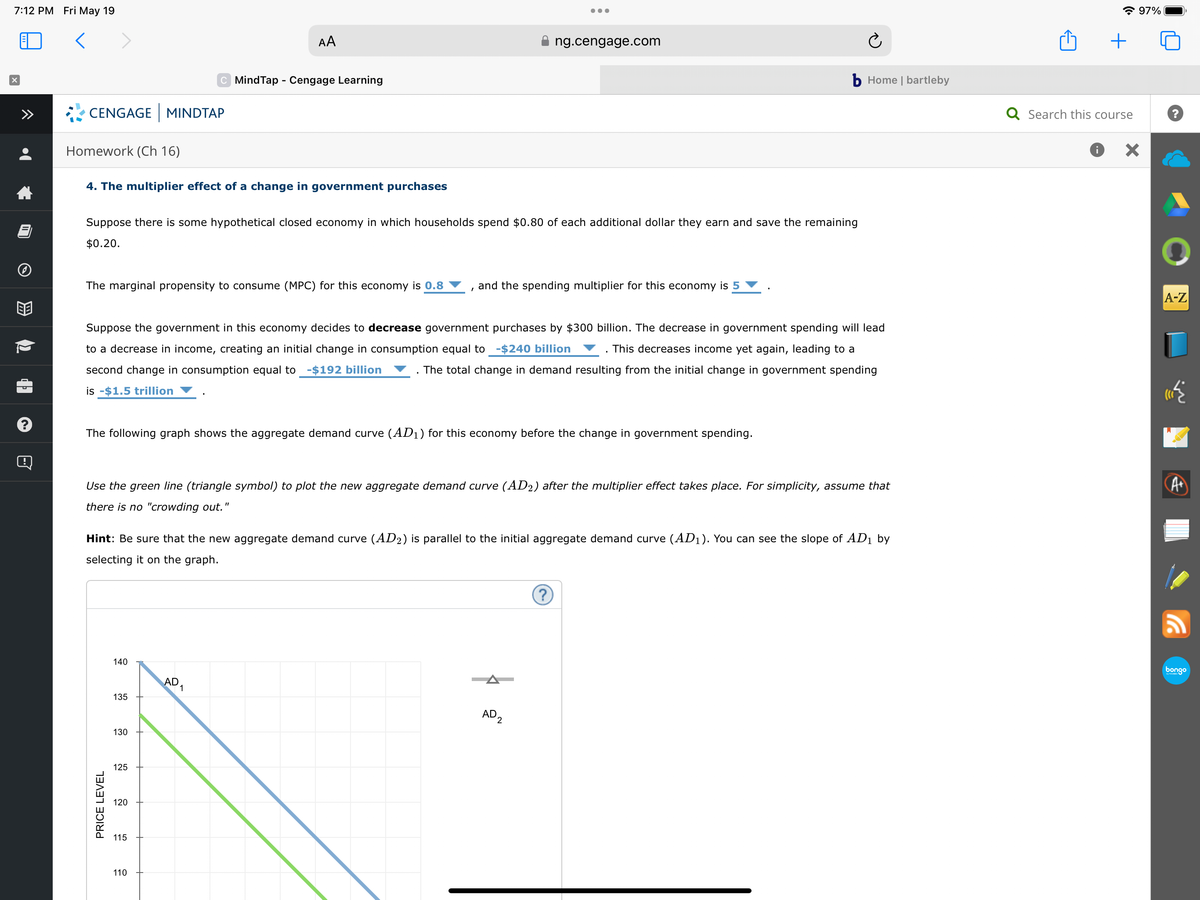
CENGAGE MINDTAP Homework (Ch 16) 4. The multiplier effect of a change in government purchases Suppose there is some hypothetical closed economy in which households spend $0.80 of each additional dollar they earn and save the remaining $0.20. The marginal propensity to consume (MPC) for this economy is 0.8, and the spending multiplier for this economy is 5. Suppose the government in this economy decides to decrease government purchases by $300 billion. The decrease in government spending will lead to a decrease in income, creating an initial change in consumption equal to -$240 billion This decreases income yet again, leading to a second change in consumption equal to $192 billion. The total change in demand resulting from the initial change in government spending is -$1.5 trillion The following graph shows the aggregate demand curve (AD₁) for this economy before the change in government spending. Use the green line (triangle symbol) to plot the new aggregate demand curve (AD₂) after the multiplier effect takes place. For simplicity, assume that there is no "crowding out." Hint: Be sure that the new aggregate demand curve (AD2) is parallel to the initial aggregate demand curve (AD1). You can see the slope of AD₁ by selecting it on the graph. PRICE LEVEL 140 135 130 125 120 115 110 AD₁ AD₂ (?) Q Search this course >
CENGAGE MINDTAP Homework (Ch 16) 4. The multiplier effect of a change in government purchases Suppose there is some hypothetical closed economy in which households spend $0.80 of each additional dollar they earn and save the remaining $0.20. The marginal propensity to consume (MPC) for this economy is 0.8, and the spending multiplier for this economy is 5. Suppose the government in this economy decides to decrease government purchases by $300 billion. The decrease in government spending will lead to a decrease in income, creating an initial change in consumption equal to -$240 billion This decreases income yet again, leading to a second change in consumption equal to $192 billion. The total change in demand resulting from the initial change in government spending is -$1.5 trillion The following graph shows the aggregate demand curve (AD₁) for this economy before the change in government spending. Use the green line (triangle symbol) to plot the new aggregate demand curve (AD₂) after the multiplier effect takes place. For simplicity, assume that there is no "crowding out." Hint: Be sure that the new aggregate demand curve (AD2) is parallel to the initial aggregate demand curve (AD1). You can see the slope of AD₁ by selecting it on the graph. PRICE LEVEL 140 135 130 125 120 115 110 AD₁ AD₂ (?) Q Search this course >

Chapter1: Making Economics Decisions
Section: Chapter Questions
Problem 1QTC

Related questions
Question
Please answer the entire question
Transcribed Image Text:7:12 PM Fri May 19
<
X
B
CENGAGE MINDTAP
Homework (Ch 16)
4. The multiplier effect of a change in government purchases
The marginal propensity to consume (MPC) for this economy is 0.8
Suppose there is some hypothetical closed economy in which households spend $0.80 of each additional dollar they earn and save the remaining
$0.20.
PRICE LEVEL
140
Suppose the government in this economy decides to decrease government purchases by $300 billion. The decrease in government spending will lead
to a decrease in income, creating an initial change in consumption equal to -$240 billion This decreases income yet again, leading to a
second change in consumption equal to -$192 billion
is -$1.5 trillion
The total change in demand resulting from the initial change in government spending
The following graph shows the aggregate demand curve (AD₁) for this economy before the change in government spending.
135
AA
C MindTap - Cengage Learning
130
Use the green line (triangle symbol) to plot the new aggregate demand curve (AD2) after the multiplier effect takes place. For simplicity, assume that
there is no "crowding out."
125
Hint: Be sure that the new aggregate demand curve (AD2) is parallel to the initial aggregate demand curve (AD₁). You can see the slope of AD₁ by
selecting it on the graph.
120
115
110
AD
●●●
1
ng.cengage.com
and the spending multiplier for this economy is 5
b Home | bartleby
AD 2
?
+
Q Search this course
i
97%
×
?
A-Z
A+
bongo

Transcribed Image Text:7:12 PM Fri May 19
<
X
B
CENGAGE MINDTAP
Homework (Ch 16)
is -$1.5 trillion
PRICE LEVEL
The following graph shows the aggregate demand curve (AD₁) for this economy before the change in government spending.
140
135
Use the green line (triangle symbol) to plot the new aggregate demand curve (AD2) after the multiplier effect takes place. For simplicity, assume that
there is no "crowding out.
130
Hint: Be sure that the new aggregate demand curve (AD2) is parallel to the initial aggregate demand curve (AD₁). You can see the slope of AD₁ by
selecting it on the graph.
125
120
115
110
105
100
0
AD
AA
C MindTap - Cengage Learning
1
1
2
3
4
5
OUTPUT (Trillions of dollars)
6
7
●●●
8
ng.cengage.com
AD2
?
b Home | bartleby
Grade It Now
Save & Continue
Continue without saving
+
Q Search this course
i
97%
×
?
A-Z
A+
bongo
Expert Solution
This question has been solved!
Explore an expertly crafted, step-by-step solution for a thorough understanding of key concepts.

This is a popular solution!

Trending now
This is a popular solution!

Step by step
Solved in 3 steps

Knowledge Booster


Learn more about
Need a deep-dive on the concept behind this application? Look no further. Learn more about this topic, economics and related others by exploring similar questions and additional content below.Recommended textbooks for you

Principles of Economics (12th Edition)
Economics
ISBN:
9780134078779
Author:
Karl E. Case, Ray C. Fair, Sharon E. Oster
Publisher:
PEARSON

Engineering Economy (17th Edition)
Economics
ISBN:
9780134870069
Author:
William G. Sullivan, Elin M. Wicks, C. Patrick Koelling
Publisher:
PEARSON
Principles of Economics (12th Edition)
Economics
ISBN:
9780134078779
Author:
Karl E. Case, Ray C. Fair, Sharon E. Oster
Publisher:
PEARSON
Engineering Economy (17th Edition)
Economics
ISBN:
9780134870069
Author:
William G. Sullivan, Elin M. Wicks, C. Patrick Koelling
Publisher:
PEARSON

Principles of Economics (MindTap Course List)
Economics
ISBN:
9781305585126
Author:
N. Gregory Mankiw
Publisher:
Cengage Learning

Managerial Economics: A Problem Solving Approach
Economics
ISBN:
9781337106665
Author:
Luke M. Froeb, Brian T. McCann, Michael R. Ward, Mike Shor
Publisher:
Cengage Learning

Managerial Economics & Business Strategy (Mcgraw-…
Economics
ISBN:
9781259290619
Author:
Michael Baye, Jeff Prince
Publisher:
McGraw-Hill Education