Concerned about the initial monitoring data, the environmental action group decides to continue to monitor the plant, and try to gather more evidence for their case. A random sample of thirty hours is selected over a period of a week. The observations (gallons of wastewater discharged per hour) are 1190 1009 921 903 980 1310 1043 1050 940 1000 1118 911 950 1111 1172 1067 1061 1066 1069 1083 1145 1129 1021 1049 1336 928 996 The output of a statistical analysis software on this dataset is shown below N Mean 1075 30 Reading the output, we find that • The sample size is n = The sample mean is = • The sample standard deviation is s = • From this we can calculate the standard error to be SE || • Calculate the t-score t - 1000 SE • The degrees of freedom for the t-score is n − 1 = 1181 1155 1357 Std. Dev. 120.4 Note that the observed sample mean is is greater than 1000 gallons per hour. This could mean that the plant is discharging more wastewater than they promised, or the plant could be in compliance, and the large numbers were due to sampling variability. To see if this is the case, we will test the hypothesis that μ = 1000 against the alternative that μ1000 at a significance level of a = 0.05. If we look up the critical value for this problem in the t-table, we would find that it is 2.045. • The magnitude of the t-score is (O smaller greater) than the critical value. Therefore we should ( O fail to reject reject) the hypothesis that μ = 1000 • Therefore the evidence ( does not does) provide significant reason to believe that the plant is discharging more wastewater on average than they claim to be.
Concerned about the initial monitoring data, the environmental action group decides to continue to monitor the plant, and try to gather more evidence for their case. A random sample of thirty hours is selected over a period of a week. The observations (gallons of wastewater discharged per hour) are 1190 1009 921 903 980 1310 1043 1050 940 1000 1118 911 950 1111 1172 1067 1061 1066 1069 1083 1145 1129 1021 1049 1336 928 996 The output of a statistical analysis software on this dataset is shown below N Mean 1075 30 Reading the output, we find that • The sample size is n = The sample mean is = • The sample standard deviation is s = • From this we can calculate the standard error to be SE || • Calculate the t-score t - 1000 SE • The degrees of freedom for the t-score is n − 1 = 1181 1155 1357 Std. Dev. 120.4 Note that the observed sample mean is is greater than 1000 gallons per hour. This could mean that the plant is discharging more wastewater than they promised, or the plant could be in compliance, and the large numbers were due to sampling variability. To see if this is the case, we will test the hypothesis that μ = 1000 against the alternative that μ1000 at a significance level of a = 0.05. If we look up the critical value for this problem in the t-table, we would find that it is 2.045. • The magnitude of the t-score is (O smaller greater) than the critical value. Therefore we should ( O fail to reject reject) the hypothesis that μ = 1000 • Therefore the evidence ( does not does) provide significant reason to believe that the plant is discharging more wastewater on average than they claim to be.

Glencoe Algebra 1, Student Edition, 9780079039897, 0079039898, 2018
18th Edition
ISBN:9780079039897
Author:Carter
Publisher:Carter
Chapter10: Statistics
Section10.1: Measures Of Center
Problem 9PPS

Related questions
Question
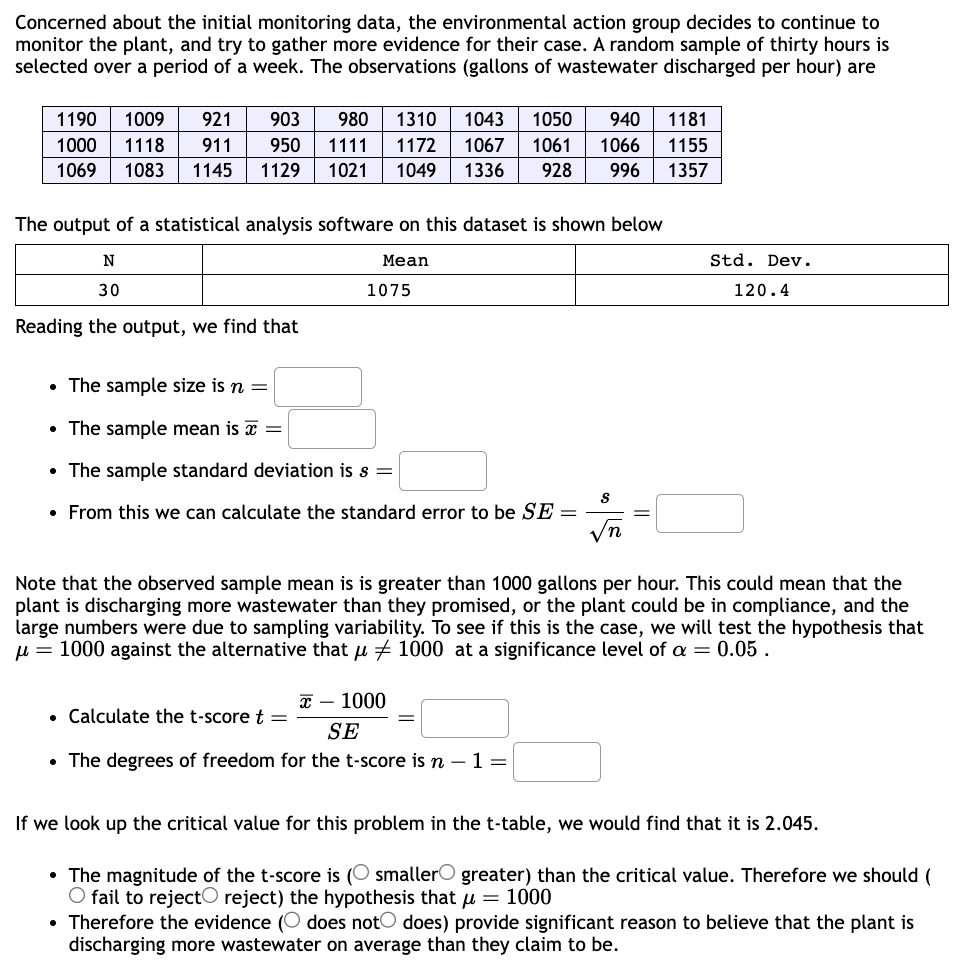
Transcribed Image Text:Concerned about the initial monitoring data, the environmental action group decides to continue to
monitor the plant, and try to gather more evidence for their case. A random sample of thirty hours is
selected over a period of a week. The observations (gallons of wastewater discharged per hour) are
1190 1009 921 903 980 1310
1000 1118 911 950 1111 1172
1069 1083 1145 1129 1021 1049
The output of a statistical analysis software on this dataset is shown below
Mean
N
30
Reading the output, we find that
1043 1050 940 1181
1067 1061 1066 1155
1336 928 996 1357
1075
• The sample size is n =
• The sample mean is =
• The sample standard deviation is s =
S
• From this we can calculate the standard error to be SE =
√√n
• Calculate the t-score t =
x - 1000
SE
• The degrees of freedom for the t-score is n-1=
Std. Dev.
Note that the observed sample mean is is greater than 1000 gallons per hour. This could mean that the
plant is discharging more wastewater than they promised, or the plant could be in compliance, and the
large numbers were due to sampling variability. To see if this is the case, we will test the hypothesis that
μ = 1000 against the alternative that μ1000 at a significance level of a = 0.05.
120.4
If we look up the critical value for this problem in the t-table, we would find that it is 2.045.
• The magnitude of the t-score is ( smaller greater) than the critical value. Therefore we should (
O fail to reject reject) the hypothesis that μ = 1000
• Therefore the evidence ( does not does) provide significant reason to believe that the plant is
discharging more wastewater on average than they claim to be.
Expert Solution
This question has been solved!
Explore an expertly crafted, step-by-step solution for a thorough understanding of key concepts.

Step by step
Solved in 3 steps

Recommended textbooks for you
Glencoe Algebra 1, Student Edition, 9780079039897…
Algebra
ISBN:
9780079039897
Author:
Carter
Publisher:
McGraw Hill
Glencoe Algebra 1, Student Edition, 9780079039897…
Algebra
ISBN:
9780079039897
Author:
Carter
Publisher:
McGraw Hill