Data were collected on the distance a frisbee will travel when thrown at a certain speed. The speed, s, is measured in miles per hour, and distance, y, is measured in yards. The regression line is given by y=3.17+52.35s. What are the slope and y-intercept of the regression line and their interpretation in the context of the problem? O The slope, 52.35, indicates that the distance increases by an average of 52.35 yards for every one mile per hour of speed. The y-intercept, 3.17, is the distance estimated by this model if the speed is zero miles per hour. O The slope, 3.17, indicates that the distance increases by an average of 3.17 yards for every one mile per hour of speed. The y-intercept, 52.35, is the distance estimated by this model if the speed is zero miles per hour. O The slope, 3.17, indicates that the distance decreases by an average of 3.17 yards for every one mile per hour of speed. The y-intercept, 52.35, is the distance estimated by this model if the speed is one mile per hour. O The slope, 52.35, indicates that the distance decreases by an average of 52.35 yards for every one mile per hour of speed. The y-intercept, 3.17, is the distance estimated by this model if the speed is one mile per hour.
Data were collected on the distance a frisbee will travel when thrown at a certain speed. The speed, s, is measured in miles per hour, and distance, y, is measured in yards. The regression line is given by y=3.17+52.35s. What are the slope and y-intercept of the regression line and their interpretation in the context of the problem? O The slope, 52.35, indicates that the distance increases by an average of 52.35 yards for every one mile per hour of speed. The y-intercept, 3.17, is the distance estimated by this model if the speed is zero miles per hour. O The slope, 3.17, indicates that the distance increases by an average of 3.17 yards for every one mile per hour of speed. The y-intercept, 52.35, is the distance estimated by this model if the speed is zero miles per hour. O The slope, 3.17, indicates that the distance decreases by an average of 3.17 yards for every one mile per hour of speed. The y-intercept, 52.35, is the distance estimated by this model if the speed is one mile per hour. O The slope, 52.35, indicates that the distance decreases by an average of 52.35 yards for every one mile per hour of speed. The y-intercept, 3.17, is the distance estimated by this model if the speed is one mile per hour.

Functions and Change: A Modeling Approach to College Algebra (MindTap Course List)
6th Edition
ISBN:9781337111348
Author:Bruce Crauder, Benny Evans, Alan Noell
Publisher:Bruce Crauder, Benny Evans, Alan Noell
Chapter3: Straight Lines And Linear Functions
Section3.CR: Chapter Review Exercises
Problem 15CR: Life Expectancy The following table shows the average life expectancy, in years, of a child born in...

Related questions
Question
This is a probability and statistics class please help me get this correct so I can study
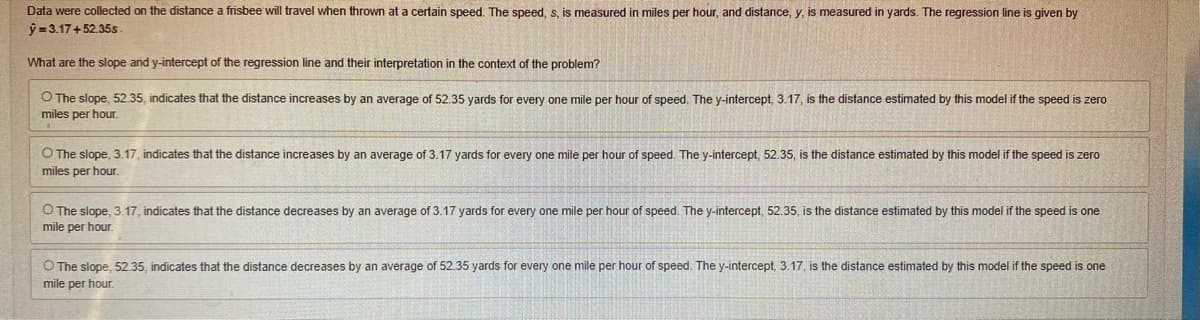
Transcribed Image Text:Data were collected on the distance a frisbee will travel when thrown at a certain speed. The speed, s, is measured in miles per hour, and distance, y, is measured in yards. The regression line is given by
y=3.17+52.35s.
What are the slope and y-intercept of the regression line and their interpretation in the context of the problem?
O The slope, 52.35, indicates that the distance increases by an average of 52.35 yards for every one mile per hour of speed. The y-intercept, 3.17, is the distance estimated by this model if the speed is zero
miles per hour.
O The slope, 3.17, indicates that the distance increases by an average of 3.17 yards for every one mile per hour of speed. The y-intercept, 52.35, is the distance estimated by this model if the speed is zero
miles per hour.
O The slope, 3.17, indicates that the distance decreases by an average of 3.17 yards for every one mile per hour of speed. The y-intercept, 52.35, is the distance estimated by this model if the speed is one
mile per hour.
O The slope, 52.35, indicates that the distance decreases by an average of 52.35 yards for every one mile per hour of speed. The y-intercept, 3.17, is the distance estimated by this model if the speed is one
mile per hour.
Expert Solution
This question has been solved!
Explore an expertly crafted, step-by-step solution for a thorough understanding of key concepts.

This is a popular solution!

Trending now
This is a popular solution!

Step by step
Solved in 3 steps

Recommended textbooks for you
Functions and Change: A Modeling Approach to Coll…
Algebra
ISBN:
9781337111348
Author:
Bruce Crauder, Benny Evans, Alan Noell
Publisher:
Cengage Learning


Algebra & Trigonometry with Analytic Geometry
Algebra
ISBN:
9781133382119
Author:
Swokowski
Publisher:
Cengage
Functions and Change: A Modeling Approach to Coll…
Algebra
ISBN:
9781337111348
Author:
Bruce Crauder, Benny Evans, Alan Noell
Publisher:
Cengage Learning
Algebra & Trigonometry with Analytic Geometry
Algebra
ISBN:
9781133382119
Author:
Swokowski
Publisher:
Cengage


Glencoe Algebra 1, Student Edition, 9780079039897…
Algebra
ISBN:
9780079039897
Author:
Carter
Publisher:
McGraw Hill

Algebra and Trigonometry (MindTap Course List)
Algebra
ISBN:
9781305071742
Author:
James Stewart, Lothar Redlin, Saleem Watson
Publisher:
Cengage Learning