Determine the five number summary and box plot for the following data (complete by hand on your blank paper and upload to the designated assignment drop box): 29 51 25 34 45 55 32 49 38 29 61 28 39
Determine the five number summary and box plot for the following data (complete by hand on your blank paper and upload to the designated assignment drop box): 29 51 25 34 45 55 32 49 38 29 61 28 39

Glencoe Algebra 1, Student Edition, 9780079039897, 0079039898, 2018
18th Edition
ISBN:9780079039897
Author:Carter
Publisher:Carter
Chapter10: Statistics
Section10.6: Summarizing Categorical Data
Problem 4BGP

Related questions
Question
Plz answer the question in 20 minutes plz it's very urgent
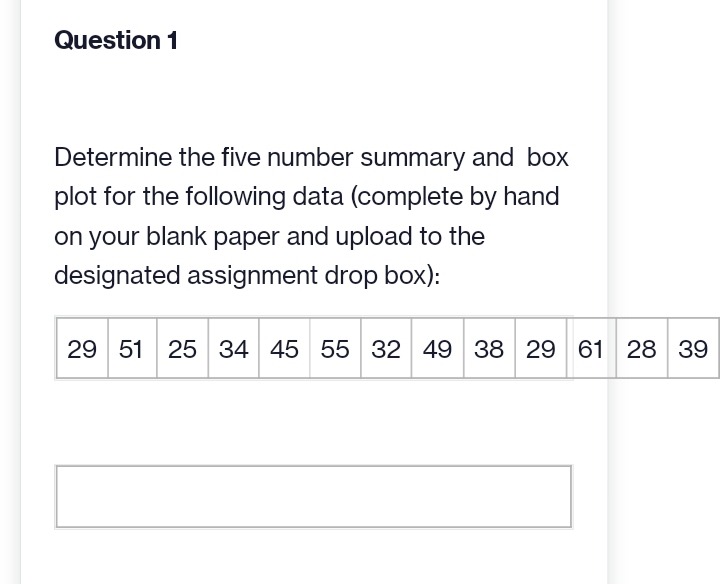
Transcribed Image Text:Question 1
Determine the five number summary and box
plot for the following data (complete by hand
on your blank paper and upload to the
designated assignment drop box):
29 51 25 34 45 55 32 49 38 29 61 28 39
Expert Solution
This question has been solved!
Explore an expertly crafted, step-by-step solution for a thorough understanding of key concepts.

Step by step
Solved in 5 steps with 1 images

Recommended textbooks for you
Glencoe Algebra 1, Student Edition, 9780079039897…
Algebra
ISBN:
9780079039897
Author:
Carter
Publisher:
McGraw Hill
Glencoe Algebra 1, Student Edition, 9780079039897…
Algebra
ISBN:
9780079039897
Author:
Carter
Publisher:
McGraw Hill