e. Indicate which curves and equilibrium interest rate show the impact of an increase in the total demand for money with no change in the money supply. Rate ofinterest, 1 B (percent) 0 E A 5 1 2 Amount of money demanded and supplied D O In the graph above this can be seen as a shift of curve 4 leftward to curve 3 and the resulting new equilibrium is E. O In the graph above this can be seen as a shift of curve 1 rightward to curve 2 and the resulting new equilibrium is A. O In the graph above this can be seen as a shift of curve 2 leftward to curve 1 and the resulting new equilibrium is B. In the graph above this can be seen as a shift of curve 3 rightward to curve 4 and the resulting new equilibrium is D. O In the graph above this can be seen as a shift of curve 1 rightward to curve 2 as well as a shift of curve 3 rightward to curve 4 and the resulting new equilbrium is C.
e. Indicate which curves and equilibrium interest rate show the impact of an increase in the total demand for money with no change in the money supply. Rate ofinterest, 1 B (percent) 0 E A 5 1 2 Amount of money demanded and supplied D O In the graph above this can be seen as a shift of curve 4 leftward to curve 3 and the resulting new equilibrium is E. O In the graph above this can be seen as a shift of curve 1 rightward to curve 2 and the resulting new equilibrium is A. O In the graph above this can be seen as a shift of curve 2 leftward to curve 1 and the resulting new equilibrium is B. In the graph above this can be seen as a shift of curve 3 rightward to curve 4 and the resulting new equilibrium is D. O In the graph above this can be seen as a shift of curve 1 rightward to curve 2 as well as a shift of curve 3 rightward to curve 4 and the resulting new equilbrium is C.

Practical Management Science
6th Edition
ISBN:9781337406659
Author:WINSTON, Wayne L.
Publisher:WINSTON, Wayne L.
Chapter7: Nonlinear Optimization Models
Section7.3: Pricing Models
Problem 9P

Related questions
Question
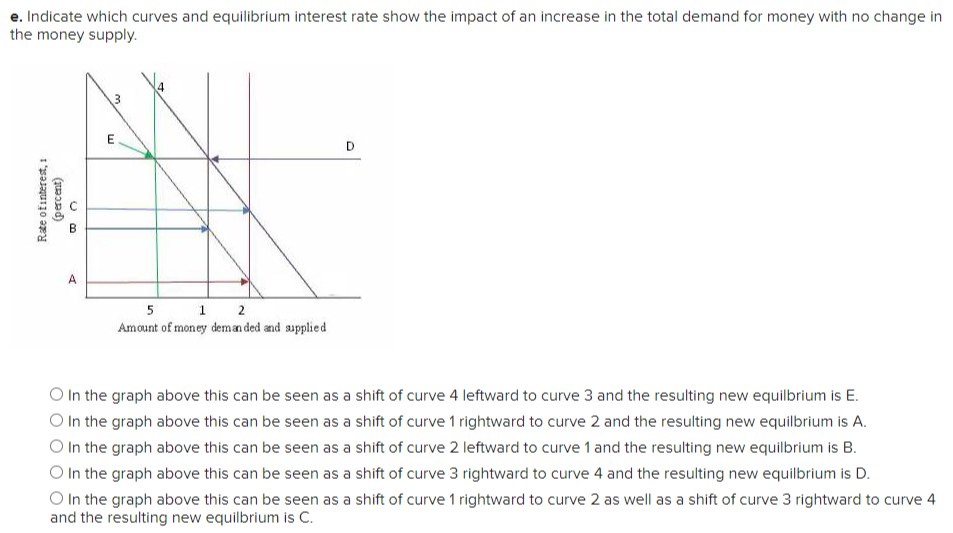
Transcribed Image Text:e. Indicate which curves and equilibrium interest rate show the impact of an increase in the total demand for money with no change in
the money supply.
Rate ofinterest, 1
B
(percent)
0
E
A
5
1 2
Amount of money demanded and supplied
D
O In the graph above this can be seen as a shift of curve 4 leftward to curve 3 and the resulting new equilibrium is E.
O In the graph above this can be seen as a shift of curve 1 rightward to curve 2 and the resulting new equilibrium is A.
O In the graph above this can be seen as a shift of curve 2 leftward to curve 1 and the resulting new equilibrium is B.
In the graph above this can be seen as a shift of curve 3 rightward to curve 4 and the resulting new equilibrium is D.
O In the graph above this can be seen as a shift of curve 1 rightward to curve 2 as well as a shift of curve 3 rightward to curve 4
and the resulting new equilbrium is C.
Expert Solution
This question has been solved!
Explore an expertly crafted, step-by-step solution for a thorough understanding of key concepts.

Step by step
Solved in 2 steps

Recommended textbooks for you
Practical Management Science
Operations Management
ISBN:
9781337406659
Author:
WINSTON, Wayne L.
Publisher:
Cengage,
Practical Management Science
Operations Management
ISBN:
9781337406659
Author:
WINSTON, Wayne L.
Publisher:
Cengage,