Elasticity and total revenue The following graph shows the daily demand curve for bikes in Chicago. Use the green rectangle (triangle symbols) to compute total revenue at various prices along the demand
Elasticity and total revenue The following graph shows the daily demand curve for bikes in Chicago. Use the green rectangle (triangle symbols) to compute total revenue at various prices along the demand

Chapter1A: Appendix: Working With Graphs
Section: Chapter Questions
Problem 1E

Related questions
Question
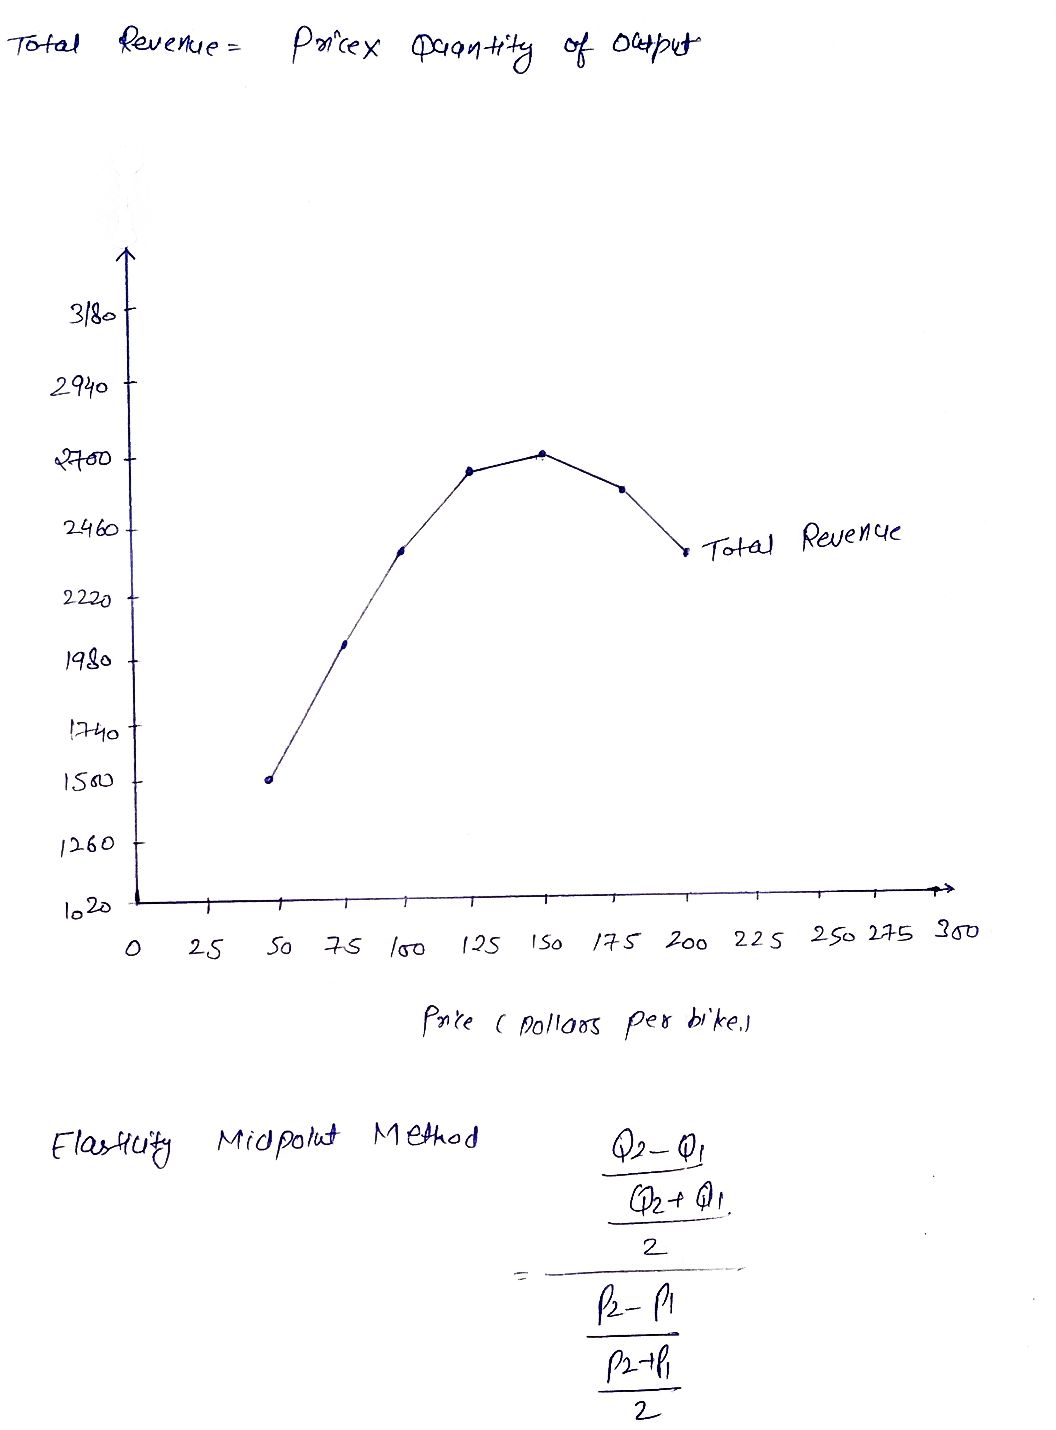
6. Elasticity and total revenue
The following graph shows the daily demand curve for bikes in Chicago.
Use the green rectangle (triangle symbols) to compute total revenue at various prices along the demand curve.
Note: You will not be graded on any changes made to this graph.

Transcribed Image Text:Use the green rectangle (triangie symbols) to compute total revenue at various prices along the demand curve.
Note: You will not be graded on any changes made to this graph.
Z75
250
Total Revenue
225
200
175
150
125
100
75
25
Demand
12
18
24 3 16
42
54 00 0g
T2
QUANTITY (Bkes)
On the following graph, use the green point (triangle symbol) to plot the annual total revenue when the market price is $50, $75, $100, $125, $150,
$175, and $200 per bike.
SSED
Total Revenue
540
w 4440
3000
2520
2040
25
100 125 150 15 200 22s no am 300
75
PRICE (Dollars per bike)
According to the midpoint method, the price elasticity of demand between points A and B is approximately
Suppose the price of bikes is ourrently $125 per bike, shown as point A on the initial graph. Because the demand between points A and B is
a $25-per-bike decrease in price will lead to
in total revenue per day.
In general, in order for a price increase to cause an increase in total revenue, demand must be
TOTAL REVENUE (Dolilars)
(awg jad sueogl 3D1Hd
Expert Solution
Step 1
*Answer:

Trending now
This is a popular solution!

Step by step
Solved in 3 steps with 3 images

Knowledge Booster


Learn more about
Need a deep-dive on the concept behind this application? Look no further. Learn more about this topic, economics and related others by exploring similar questions and additional content below.Recommended textbooks for you