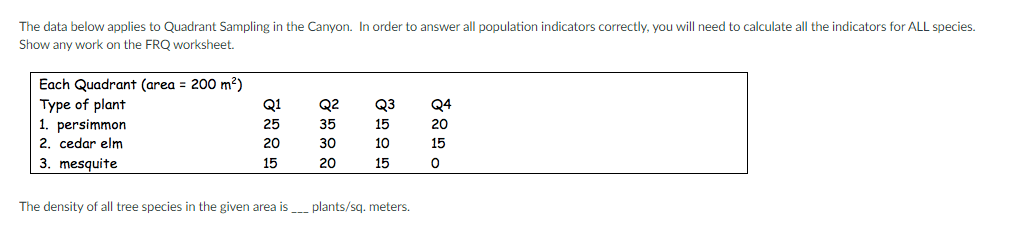
elow applies to Quadrant Sampling in the Canyon. In order to answer all population indicators correctly, you will need to calculate all the indicators for ALL species. vork on the FRQ worksheet. Quadrant (area = 200 m²) of plant Q1 Q2 Q3 Q4 simmon 25 35 15 20 dar elm squite 20 30 10 15 15 20 15 y of all tree species in the given area is plants/sq. meters.


Q: A biologist gathered data to show the interaction of the golden-cheeked warbler and juniper tree…
A: It is given that the bar colored in light grey gives the number of juniper tree person acre and the…
Q: 1929, 13 white-tailed deer were introduced to an isolated island with no natural predators. A survey…
A: California false Indigo tree when grown from seed takes three to four years to flower. So if leaves…
Q: Which of the lab field techniques would you use to answer each of the following questions? Answer…
A: Vegetation: A assemblage of plants growing together in a specific location is referred to as…
Q: Researchers in Georgia collected survivorship data in populations of two plant species, elf orpine…
A: We know that, Survivorship = (Number of individual at specific time)/ Initial number of individual…
Q: Screenshot showing 10 Populations (trials) Number of trials fixed generation to trials lost (A…
A: The picture is showing the simulation for 10 population. The alleles frequency is found along X…
Q: Miss l is bored in the summer, so she wants to estimate the population of weeds on her property. The…
A: Samples are selected when it is not possible to count the number of individuals due to the larger…
Q: A large conservation agency in Austria is interested in the status of the endangered newt species,…
A: Effective Population Size (Ne)The number of people that effectively participate in manufacturing the…
Q: Which of the following methods will provide information to an ecologist about both the size and…
A: Which of the following methods will provide information to an ecologist about both the size and…
Q: Describe two reasons why plant populations can be more difficult to establish and two reasons they…
A: Plant populations are more difficult to establish because plant rooted in the soil. Plants may…
Q: Data Collection Generations Population Size 189 Population Size Proportion R allele 0.55 Proportion…
A: Hello there! This questions needs you to analyse the data and then give interpretation. When allele…
Q: Contrast the selective pressures operating in high-density populations (those near the carrying…
A: Selection pressures are external agents that can change or affects the organism’s ability to survive…
Q: Which of the lab field techniques would you use to answer each of the following questions? Answer…
A: In nature, there have many lab techniques for the collection of data and maintains the balance of…
Q: Miss L is bored in the summer, so she wants to estimate the population of weeds on her property. The…
A: Population ecology is the study that mainly deals with a number of individuals organisms that are…
Q: A student decides to use the mark-recapture technique to estimate thepopulation size of mosquitofish…
A: Population size or density is the total number of individuals per unit area at a given time.…
Q: A biologist is studying the way in which the environment is affecting the reproductive rates of a…
A: Ecology is the scientific analysis of living organisms and their interactions. There are different…
Q: There was another research effort underway to estimate the squirrel population on the PLU campus.…
A: 1st time capture 15 squirrel, mark and release 2nd time capture 15 squirrel where 5 are marked.
Q: Determine the percent population of bright guppies at Experimental Site 3. (NO UNITS) Experimental…
A: A population is the number of organisms of the same species that live in a particular geographic…
Q: Describe one method for collecting natural history information from populations/species in the field…
A: Natural history collections provide an immense record of biodiversity on Earth. These repositories…
Q: Black-tailed prairie dogs used to be found in Alberta, but due to their destructive nature on…
A: It is given that the Prairie dogs are found in an Alberta. They have black colored tail.
Q: If a population of squirrels is 245, has a BR of 34/year, DR of 28/year, IR of 82/year and ER of…
A: Introduction :- The term "population" usually refers to the total number of people living in a…
Q: You are contracted by the City of Ottawa to estimate the size of the population of small mouth bass…
A: The easiest way to know the size of a population is to measure all the individuals. But it is often…
Q: Which of the following five populations are at Hardy-Weinberg equilibrium? Population AA Aa aa 0.25…
A: Hardy Weinberg Equilibrium states that genetic variation within the population remains constant from…
Q: The distribution of a herd of deer is shown in Fig. 4.17. Using the values below for the dimensions…
A: Introduction A population is a group of individuals of the same species living in the same region…
Q: In studying species relationship, what kind of tool should use to understand between population…
A: The tools which are used to study the population are known as demographic parameters. There use many…
Q: when population density does not change over time 1. then r=0 and lamba=1 2. then r=1 and lambda=0…
A: Geometric increase in growth of population refers the scenario when the population increases by a…
Q: Identify the Shannon diversity index in the two hypothetical communities below. Which of the two…
A: Shannon diversity index or Shannon-Wiener diversity index is commonly used to characterize species…
Q: Ecology students are required to do a lab research project, and two students decide to study the…
A: The dependent variable responds to the independent variable. It is called dependent because it…
Q: Humans are beginning to fragment populations more and more: which population structure is most…
A: Habitat fragmentation describes the emergence of discontinuities (fragmentation) in an organism's…
Q: e population is in Hardy-Weinberg equilibrium, what is the expected (projected) frequency of…
A: According to Hardy Weinberg Equilibrium states that allele frequency remains constant from…
Q: Calculate for the Diversity Indices of the different communities given below using PAST. Relative…
A: Relative abundance is a quantitative measure of finding out the percent of a population of a certain…
Q: A population of rabbits was determined to have a birth rate of 200 and mortality rate of 50 per…
A:
Q: Due to recent habitat destruction and deforestation, multiple isolated populations of poison dart…
A: Introduction :- Deforestation is defined as the clearance of a patch of land of forest ecosystem…
Q: The problem is in the included image. Please kindly include the work.
A: Quadrant sampling : Quadrant is basically a square or frame in which in which we know how many…
Q: What is the population size after 20 timesteps assuming exponential dynamics, an initial population…
A: Introduction :- The curve of an exponential function is formed by a pattern of data that exhibits…
Q: Use the logistic equation to estimate population size two generations (Nt+2) after a population was…
A: Introduction: A population is all the organisms of the same group or species, which live in a…
Q: a) What are the effective population sizes Ne for each Generation 1 through 4, relative to…
A: a. Relative comparision to 0 generation, generation 1 to 4 have less number of population.size. Bcz…
Q: The data below applies to Quadrant Sampling in the Canyon. In order to answer all population…
A: Quadrat sampling is a method by which organisms in a sample of the habitat are counted manually. It…
Q: Calculate the estimated population size, N, given a study that initially marked 100 animals and…
A: (11) The method of estimation is called the Lincoln Index P = (N1 x N2 )/ R. P = total size of…
Q: What is the trend in the data during the first 12 years of the periodshown? Draw a line through the…
A: The development and use of statistical approaches to a wide range of problems in biology is defined…
Q: In addition to assessing tree diversity in the woodlots, you decide to evaluate the population…
A: Introduction :- Environment and it's forces ( like natural selection and carrying capacity) are a…
Q: shown in the graph below. Which of the following scenarios is the most likely explanation of the…
A: There are different types of pollinators in nature such as 20 butterflies and other insects that…
Q: You have determined that a community consisting of 12 species has Shannon Diversity index score of…
A: The correct answer is 0.71 that is option d. The explanation to the above answer is as follows:…
Q: A recent study investigated the population size of burrowing owls in the Imperial Valley. In 2015, a…
A:
Q: A major moose population survey was completed in 1993–94 to det densities, and sex and age ratios.…
A: density = 0.45 moose/km2 Area= 5788 km2 What was the total population size (N)= 5788*0.45 = 2604.6…
Q: this program graph (beloW). 2500 Deer and Wolf Population Size 2400 30 -28 2300 -26 24 2200 -22 walf…
A: Predations In ecology, predation is the relationship between predators and prey. The predator eats…
Q: Draw a stacked bar chart showing, for each species, the percentage of observations made in each…
A: The manner or pattern in which particular or multiple species are spatially arranged in a particular…
Q: How do you calculate N (population size)? Is the mark-recapture method a reliable way to estimate…
A: For calculating Population size N by dividing the number of individuals receiving a service (M) by…
Q: A researcher who is interested in the number of individuals in a population of black bears and their…
A: Bears with a higher density of houses in their home ranges (~ 75 houses/km2) displayed less…
The problem is in the image. Please kindly include the work :)

Step by step
Solved in 2 steps

- Which of the lab field techniques would you use to answer each of the following questions? Answer choices A-E. What is the density of dandelions in the lawn? Is the population of warblers in Scotland Run park in decline? A. Daubenmire plots B. BBS C. Mark/Recapture D. Point Centered Quarter E. Life Table AnalysisA gardening company would like to predict the density of the weed population in a yard before it is sprayed with pesticide. The yard measures 200 cm × 100 cm. The gardener places four 2.0 cm × 1.0 cm quadrats randomly in the park, and calculates the weed counts of 22, 46, 32 and 40 weeds in the 4 quadrats. Solve for the density of the weed population. Please show all your workMiss l is bored in the summer, so she wants to estimate the population of weeds on her property. The property measures 20 m x 20 m. She randomly places ten 1 m x 1 m quadrats on her property as shown in the diagram below. What is the estimated population size?
- In a particular population of Paramecium species, 30 Paramecia were found in 4 mL of sample pond water. At another location, 85 Paramecia were found in 40 mL of sample pond water. What is the change in density of the Paramecium species? Express your answer rounded to two decimal places.Which of the following methods will provide information to an ecologist about both the size and density of a population? a. mark and recapture b. mark and release c. quadrat d. life tableWhich of the lab field techniques would you use to answer each of the following questions? Answer choices on bottom A-E. What is the population size of Black Bears in New Jersey? What is the dominate tree species in the forest on campus? How many species of birds are found within five miles of my home? Are the Beech trees in the forest on campus producing enough offspring to replace themselves? What is the density of dandelions in the lawn? Is the population of warblers in Scotland Run park in decline? A. Daubenmire plots B. BBS C. Mark/Recapture D. Point Centered Quarter E. Life Table Analysis
- What specific RIM is being described by each of the following statements? Write your answer on the space provided before each item. Explain your answer in each letter 5 RIM Habitat Isolation ,Temporal Isolation , Behavioral Isolation , Mechanical Isolation , Genetic Isolation _________C)Red-legged frogs (Rana draytonii) breed from around November to late April,while yellow-legged frogs (Rana boylii) breed from around late April to June. __________D)The structure of bucket orchid (genus Coryanthes) flowers allows pollination only by a certain species of orchid bees (tribe Euglossini). E) Offspring of hybrid cotton (genus Gossypium) plants either dieA population of wolves in a national park is known to be 150 individuals. As wildlife ecologist, you are tasked with assessing the accuracy of the mark and recapture technique. At the start, you mark 30 wolves, and your recapture yields 20 wolves, 5 of whom are marked. State whether the mark and recapture data results in an over or underestimation of the actual population size, and show work to support your claim.You have been researching the biodiversity of different species of lizards in the Florida Everglades. You select a one square acre plot of land and begin tagging and counting the different reptiles found in that area over 6 months. After 6 months of research, you collected the following data: Species Count Green Anole 16 Brown Anole 72 American Alligator 3 Burmese python 2 Corn Snake 9 Eastern Glass Lizard 8 Use the blanks below to answer the following questions: 1. What is the biodiversity index of the one acre lot observed? 2. If you collected the same information for a second square acre 10 miles away and determined that acre to have a biodiversity index of 0.37, would you consider the first area to be biologically diverse and why or why not? 3. What do you think is suppressing biodiversity in the first acre counted? a b c
- After examining two specific organisms on Movebank.org, consider the movement trends of the two organisms and discuss the importance of this type of data. Consider the resources related to tracking methods and discuss the benefits of this kind of research in understanding and protecting wildlife populations. Is it important to know the details of wildlife populations? Is there a point do where scientists go too far? Share your opinion on the importance of knowing the size of a given population and defend your position.In 1929, 13 white-tailed deer were introduced to an isolated island with no natural predators. A survey was conducted once a year to estimate the population of deer on the island. The table shows the deer population over the first five years on the island. The deer fed on many of the native plants found on the island, including the California false indigo, a thornless shrub that is a preferred food source on the island for deer. Based on the data, which of the following graphs correctly predicts the population of California false indigo from 1929 to 1941? Year of Survey Population of Deer 1929 13 1932 29 1935 66 1938 157 1941 398 image 1 because the California false indigo will be able to reproduce faster than it can be consumed by the deer and will be unaffected by the deer population, maintaining its current population image 2 because the increasing number of deer will help spread seeds of the plant and lead to a rise in…To measure the population of lake trout in a 250-hectare lake, 100 individuals were netted and marked with a fin clip, and then returned to the lake. The next week, the lake is netted again, and out of the 300 lake trout that are caught, 15 have fin clips. Using the capture-recapture estimate, the lake trout population size could be closest to? Also, what formula do I use to solve this problem? Thank You!
