
Related questions
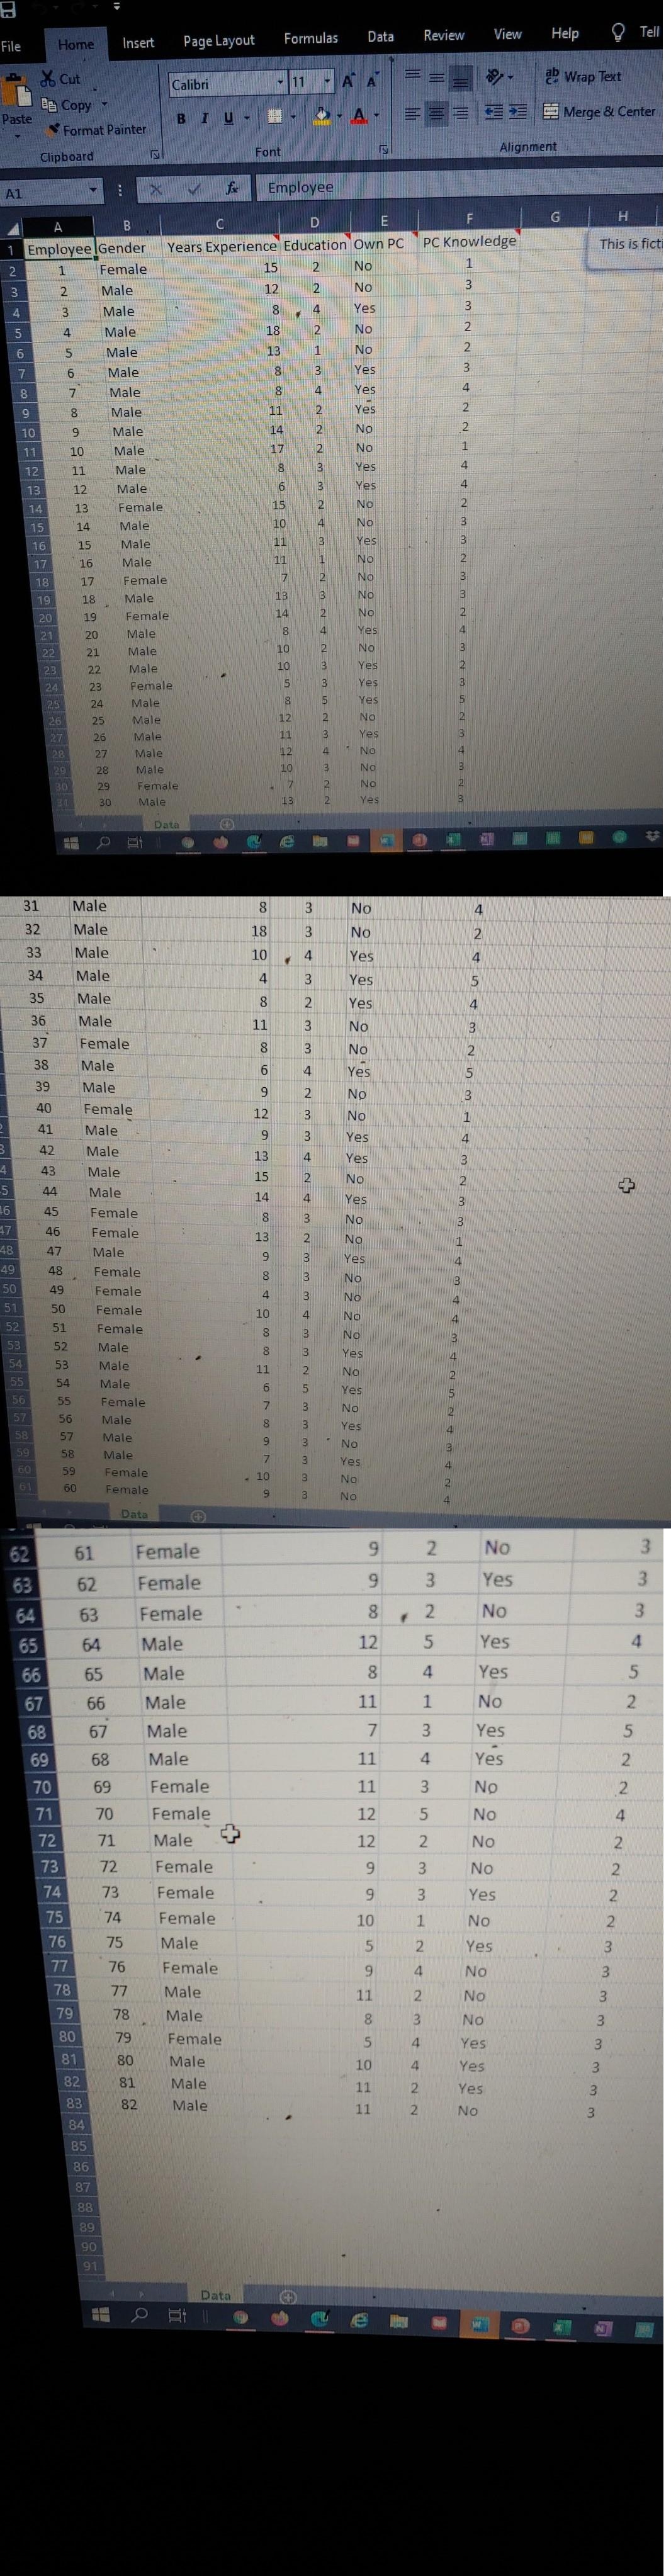
I need some assistance solving Part B of this question. Refer to the excel data in the image provided to answer Part B. SoftBus Company sells PC equipment and customized software to small companies to help them manage their day-to-day business activities. Although SoftBus spends time with all customers to understand their needs, the customers are eventually on their own to use the equipment and software intelligently. To understand its customers better, SoftBus recently sent questionnaires to a large number of prospective customers. Key personnel—those who would be using the software—were asked to fill out the questionnaire. SoftBus received 82 usable responses, as shown in the file. You can assume that these employees represent a random sample of all of SoftBus's prospective customers. SoftBus believes it can afford to spend much less time with customers who own PCs and score at least 4 on PC Knowledge. Let's call these the "PC-savvy" customers. On the other hand, SoftBus believes it will have to spend a lot of time with customers who do not own a PC and score 2 or less on PC Knowledge. Let's call these the "PC-illiterate" customers, SoftBus believes its profit from each prospective customer depends on the customer's level of PC knowledge. It divides the customers into three classes: PC-savvy, PC-illiterate, and all others. As a rough guide, SoftBus figures it can gain profit P1 from each PC-savvy customer, profit P3 from each PC-illiterate customer, and profit P2 from each of the others. a. What values of P1, P2, and P3 seem reasonable? For example, would you expect P1 < P2 < P3 or the opposite? P1 > P2 > P3 (is the correct answer) Now, answer part B. b. Using a profit P1 of $5,000, a profit P2 of $4,500, and a profit P3 of $4,000, calculate a 95% confidence interval for the mean profit per customer that SoftBus can expect to obtain. (Round your answers to one decimal place.) Lower Limit = Upper Limit =


Step by stepSolved in 2 steps


- Search the web... of colleg D Facts & Figures - Hig D What are the negativ Why Instagram Is the Why Kids Are Using D Historical Inaccuracie O Blog Post 2: TH MAssessment Services - Google Chrome A assessment.casa.uh.edu/Assessment/Root/Pages/TestTaker/Quiz.aspx?id%3D7D226DEB-3DC7-4E85-ASFE-833369567BAS ) O None of the above Question 10 In the following diagram, AMCP AMTC, which of the following statements are true? (The diagram may not be drawn to scale.) M T. МP a) O PC MC %3D MT MC MT MP PC MT b) MC СТ MC MP PC MC MC СТ MT MP CT MC d) O MC PC MT MC CT MC e) O МP PC MT f) O None of the above re to searcharrow_forwardhelp pleasearrow_forwardezto.mheducation.com/ext/map/index.html?_con=con&external_browser=0&launchUrl=https%253A%252F%252Fnewconnect.mheducat... Q | Exam 13 Ic raw Required information NOTE: This is a multi-part question. Once an answer is submitted, you will be unable to return to this part. 1 1 1 Consider the following zero-one matrix 0 1 1 representing a relation on the ordered set (a, b, c). 1 The relation in the given matrix is not an equivalence relation. True or False True Saved False Save & Ex 51°F Sunnyarrow_forward
- Edit View History Bookmarks People Window Help nd Masteri ps://open Do Homework - Jaelyn Dancy xl.com/Student/PlayerHomework.aspx?homeworkld-515742856&questionld-18flushed-false&cld-5 Wright MTH112 20217 E-Learning Spring 2019 Jaelyn Dancy Homework: HW - 2.4 ath score: 0 of 1 pt 2.4.43 11 of 12 (10 complete) HW Sco 2 Solve the equation x+2x -5x-6 0 given that 2 is a zero of fx)x 2x-5x -6 The solution set is. (Use a comma to separate answers as needed.) Enter your answer in the answer box and then click Check Answer. All parts showing Clear All 5 MacBook Proarrow_forwardThe National Highway Traffic Safety Administration (NHTSA) collects traffic safety-related data for the U.S. Department of Transportation. According to NHTSA's data, fatal collisions in were the result of collisions with fixed objects (NHTSA website, https://www.careforcrashvictims.com/wp-content/uploads/2018/07/Traffic-Safety-Facts-2016_-Motor-Vehicle-Crash-Data-from-the-Fatality-Analysis-Reporting-System-FARS-and-the-General-Estimates-System-GES.pdf). The following table provides more information on these collisions.Excel File: data04-21.xlsx Fixed Object Involved in Collision Number of Collisions Pole/post 1,416 Culvert/curb/ditch 2,516 Shrubbery/tree 2,585 Guardrail 896 Embankment 947 Bridge 231 Other/unknown 1,835 Assume that a collision will be randomly chosen from this population. Round your answers to four decimal places.arrow_forwardurse_assessment_id%3_202 Apps MGmail O Maps YouTube Office of the Regist... Translate Imported From Edg * Question Completion Status: QUESTION 7 Which of the following sets defines the shaded area on the diagram below. TNS O S-T O SUT OT-S QUESTION 8 Click on the diagram for the intersection of sets A and B. A B Selected Coordinates Click Save and Submit to save and submit. Click Save All Answers to save all answers. e Type here to searcharrow_forward
- Glencoe Algebra 1, Student Edition, 9780079039897...AlgebraISBN:9780079039897Author:CarterPublisher:McGraw Hill
 Holt Mcdougal Larson Pre-algebra: Student Edition...AlgebraISBN:9780547587776Author:HOLT MCDOUGALPublisher:HOLT MCDOUGAL
 Elementary Geometry For College Students, 7eGeometryISBN:9781337614085Author:Alexander, Daniel C.; Koeberlein, Geralyn M.Publisher:Cengage,