For a particular regression analysis, SST = 218.8548 and SSR = 205.2173. a. Obtain the coefficient of determination. b. Determine SSE. a. Determine the value of r², the coefficient of determination. 2=1 (Round to four decimal places as needed.) b. Find SSE. SSE= (Round to four decimal places as needed.)
For a particular regression analysis, SST = 218.8548 and SSR = 205.2173. a. Obtain the coefficient of determination. b. Determine SSE. a. Determine the value of r², the coefficient of determination. 2=1 (Round to four decimal places as needed.) b. Find SSE. SSE= (Round to four decimal places as needed.)

Chapter4: Linear Functions
Section: Chapter Questions
Problem 30PT: For the following exercises, use Table 4 which shows the percent of unemployed persons 25 years or...

Related questions
Question
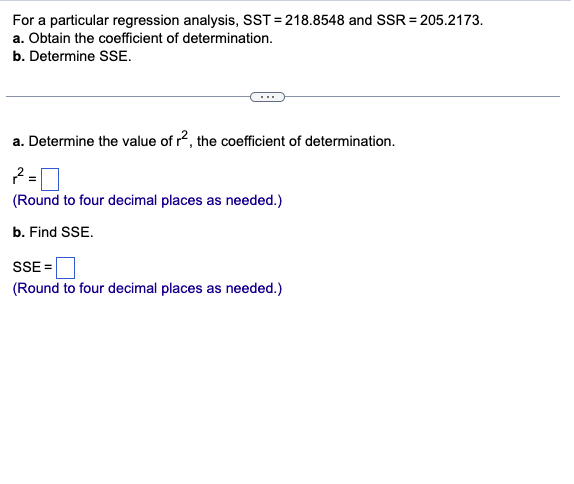
Transcribed Image Text:For a particular regression analysis, SST=218.8548 and SSR = 205.2173.
a. Obtain the coefficient of determination.
b. Determine SSE.
a. Determine the value of r2, the coefficient of determination.
2=0
(Round to four decimal places as needed.)
b. Find SSE.
SSE =
(Round to four decimal places as needed.)
Expert Solution
This question has been solved!
Explore an expertly crafted, step-by-step solution for a thorough understanding of key concepts.

Step by step
Solved in 3 steps

Recommended textbooks for you

Algebra & Trigonometry with Analytic Geometry
Algebra
ISBN:
9781133382119
Author:
Swokowski
Publisher:
Cengage

Functions and Change: A Modeling Approach to Coll…
Algebra
ISBN:
9781337111348
Author:
Bruce Crauder, Benny Evans, Alan Noell
Publisher:
Cengage Learning
Algebra & Trigonometry with Analytic Geometry
Algebra
ISBN:
9781133382119
Author:
Swokowski
Publisher:
Cengage
Functions and Change: A Modeling Approach to Coll…
Algebra
ISBN:
9781337111348
Author:
Bruce Crauder, Benny Evans, Alan Noell
Publisher:
Cengage Learning