
MATLAB: An Introduction with Applications
6th Edition
ISBN: 9781119256830
Author: Amos Gilat
Publisher: John Wiley & Sons Inc
expand_more
expand_more
format_list_bulleted
Related questions
Question
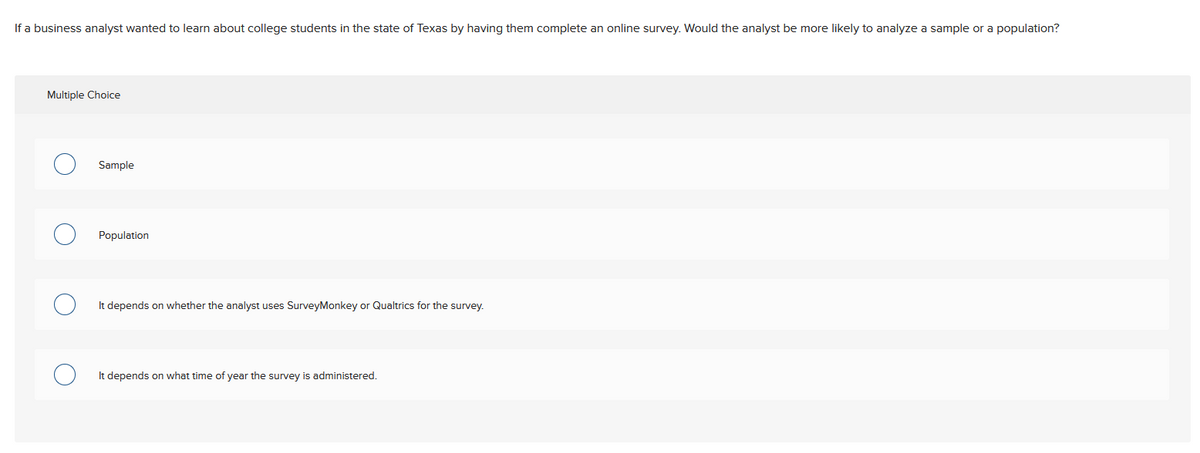

Transcribed Image Text:If a business analyst wanted to learn about college students in the state of Texas by having them complete an online survey. Would the analyst be more likely to analyze a sample or a population?
Multiple Choice
Sample
Population
It depends on whether the analyst uses SurveyMonkey or Qualtrics for the survey.
It depends on what time of year the survey is administered.
Expert Solution
This question has been solved!
Explore an expertly crafted, step-by-step solution for a thorough understanding of key concepts.

This is a popular solution

Trending nowThis is a popular solution!

Step by stepSolved in 3 steps

Knowledge Booster

Similar questions
- Charlie isinterested in whether elementary school students, middle school students, or high school students spend more time reading in the summer. In the beginning of the school year he asks 20 elementary school students, 15 middle school students and 40 high school students to report the number of pages they read over the summer. What statistical test should Charlie use to test his research question?arrow_forwardSolve with steps Please.arrow_forwardMarvel movies - Kylie is a huge fan of Marvel movies. She finds an online poll that asks, "What is the best movie of the Marvel Cinematic Universe?" and saves the data. For a class project she wants to determine if the distribution of her classmates' favorite Marvel movies is different from the one published in the online poll. She surveys the 215 students in her statistics class. The table below contains the percentages reported by the online poll and the observed counts from her classmates. Report all calculated answers to 4 decimal places. Poll Observed Movie Percentage Count Captain America: The Winter Soldier 18.1% 34 Guardians of the Galaxy 14% 34 The Avengers 13.9% 32 Captain America: Civil War 11.4% 24 Iron Man 7.5% 20 Doctor Strange 3.7% 10 Other Marvel movie 31.4% 61arrow_forward
- Create a Study For this discussion, you will come up with an example of a situation in which two means would need to be compared, and describe which test would be the most appropriate. Develop a main response in which you address the following: Describe a possible study that could be conducted to compare two groups means. What would the main topic be? What groups would be compared? What data would be collected? Identify the test that would be the best choice to compare the group means. Explain why this test is the most appropriate for your example.arrow_forwardYou see the following headline on the news: "A new political poll finds that less than 20% of Americans are happy with the new Common Core standards in education".At the bottom of the television screen you see that a sample of 46 Americans were polled. Explain why this might represent sampling bias and give one solution to reduce the potential bias.arrow_forwardPlease don't hand writing suliutioarrow_forward
- Please answer questions below Below is a sample of 64 responses of a survey of Ward 3 residents in Washington, D.C. The survey asked "Do you support the statehood of Washington, D.C.?" "Yes" was recorded as "1" and "No" was recorded as "0" in the table. Statehood? a. What is the sample proportion of residents who support DC statehood? 1 1 1 1 0 1 b. If the population proportion of residents who support DC statehood is 0.7, 1 what is the standard error of the proportion? 0 0 0 1 1 c. Is the sampling distribution of the proportion normally distributed? 0 1 1 0 1 d. What is the probability of a sample proportion being greater than 1 the value of…arrow_forwardPart c pleasearrow_forwardThe midterm and final exam grades for a statistics course are provided in the data set below. Jaymes, a student in the class, scored 86 on both exams. Treat the given data sets as samples. Midterm: 80, 78, 85, 82, 79, 79, 78, 86, 80, 84, 78, 84, 80, 84, 81, 78, 81, 82, 78, 84 Final: 81, 88, 68, 69, 69 81, 82, 86, 76, 71, 72, 68, 77, 86, 68, 83, 84, 71, 81, 87 z-score for midterm: 1.857 z-score for final: 1.181 Based on the z-scores calculated above, which of Jaymes's grades is more unusual, the midterm grade or the final exam grade? Select the correct answer below: A. The absolute value of the z-score for the final exam grade is greater than for the midterm grade, so the final exam grade is more unusual. B. The absolute value of the z-score for the midterm exam grade is less than for the final grade, so the midterm grade is more unusual. C. The absolute value of the z-score for the midterm exam grade is greater than for the final grade, so the midterm grade is more…arrow_forward
- The Student Union President conducted a survey to estimate the proportion of first year students who participated in the social activities organized by the Student Union. Which of the following surveying options does NOT affect the presidents ability to generalize the survey to all first year students. The president put the survey on the Student Union webpage a Monday and collected the responses at the end of the week. All of the other options present a problem for generalizing the results. The president polled all students coming out of the Student Union on a given Monday. The freshmen class consists of 3000 students. A random sample of only 300 were sent a survey. Only 150 responded. The survey was sent only to first year students enrolled in statistics courses because all students need to satisfy a statistics general education requirement.arrow_forwarddoesn't the mean of a sample population equal the true proportion?arrow_forwardThe Bureau of Labor Statistics reports that the official unemployment rate for Black people was 10.4% and 4.7% for White people in February 2015. Select all correct answers for this question. O The samples of white and black people are independent. The explanatory variable is the unemployment rate. The response variable is the unemployment rate. The response variable is race.arrow_forward
arrow_back_ios
SEE MORE QUESTIONS
arrow_forward_ios
Recommended textbooks for you
- MATLAB: An Introduction with ApplicationsStatisticsISBN:9781119256830Author:Amos GilatPublisher:John Wiley & Sons Inc
 Probability and Statistics for Engineering and th...StatisticsISBN:9781305251809Author:Jay L. DevorePublisher:Cengage Learning
 Statistics for The Behavioral Sciences (MindTap C...StatisticsISBN:9781305504912Author:Frederick J Gravetter, Larry B. WallnauPublisher:Cengage Learning
  Elementary Statistics: Picturing the World (7th E...StatisticsISBN:9780134683416Author:Ron Larson, Betsy FarberPublisher:PEARSON
 The Basic Practice of StatisticsStatisticsISBN:9781319042578Author:David S. Moore, William I. Notz, Michael A. FlignerPublisher:W. H. Freeman
 Introduction to the Practice of StatisticsStatisticsISBN:9781319013387Author:David S. Moore, George P. McCabe, Bruce A. CraigPublisher:W. H. Freeman
MATLAB: An Introduction with Applications
Statistics
ISBN:9781119256830
Author:Amos Gilat
Publisher:John Wiley & Sons Inc
Probability and Statistics for Engineering and th...
Statistics
ISBN:9781305251809
Author:Jay L. Devore
Publisher:Cengage Learning
Statistics for The Behavioral Sciences (MindTap C...
Statistics
ISBN:9781305504912
Author:Frederick J Gravetter, Larry B. Wallnau
Publisher:Cengage Learning
Elementary Statistics: Picturing the World (7th E...
Statistics
ISBN:9780134683416
Author:Ron Larson, Betsy Farber
Publisher:PEARSON
The Basic Practice of Statistics
Statistics
ISBN:9781319042578
Author:David S. Moore, William I. Notz, Michael A. Fligner
Publisher:W. H. Freeman
Introduction to the Practice of Statistics
Statistics
ISBN:9781319013387
Author:David S. Moore, George P. McCabe, Bruce A. Craig
Publisher:W. H. Freeman