In a study, people were observed for about 10 seconds in public places, such as malls and restaurants, to determine whether they smiled during the randomly chosen 10-second interval. The table shows the results for comparing males and females. Complete parts a through c below. The percentage of women who were smiling in the sample was 50.86 %. (Round to two decimal places as needed.) Compare the sample percentages. The percentage of people who were smiling was greater for the women. a. Find and compare the sample percentages of men who were smiling and women who were smiling. The percentage of men who were smiling in the sample was 48.06%. (Round to two decimal places as needed.) b. Treat this as though it was a random sample, and test whether there are differences in the proportion of men and the proportion of women who smile. Use a significance level of 0.05. OA. Ho: P1 P2 HA: P₁ P₂ Male 3243 Smile No Smile 3505 Determine the hypotheses for this test. Let p, represent the population proportion of men who smile, and let P2 represent the population proportion of women who smile. Choose the correct answer below. O D. Ho: P1 P2 H: P₁ P₂ OB. Ho: P1 P2 HA: P1 P2 OE. Ho: P1 P2 H: P₁ P₂ Female 4475 4323 OC. Ho: P1 P2 HA: P1 P₂ F. Ho: P₁ = P2 H₂: P₁ P₂ 0
In a study, people were observed for about 10 seconds in public places, such as malls and restaurants, to determine whether they smiled during the randomly chosen 10-second interval. The table shows the results for comparing males and females. Complete parts a through c below. The percentage of women who were smiling in the sample was 50.86 %. (Round to two decimal places as needed.) Compare the sample percentages. The percentage of people who were smiling was greater for the women. a. Find and compare the sample percentages of men who were smiling and women who were smiling. The percentage of men who were smiling in the sample was 48.06%. (Round to two decimal places as needed.) b. Treat this as though it was a random sample, and test whether there are differences in the proportion of men and the proportion of women who smile. Use a significance level of 0.05. OA. Ho: P1 P2 HA: P₁ P₂ Male 3243 Smile No Smile 3505 Determine the hypotheses for this test. Let p, represent the population proportion of men who smile, and let P2 represent the population proportion of women who smile. Choose the correct answer below. O D. Ho: P1 P2 H: P₁ P₂ OB. Ho: P1 P2 HA: P1 P2 OE. Ho: P1 P2 H: P₁ P₂ Female 4475 4323 OC. Ho: P1 P2 HA: P1 P₂ F. Ho: P₁ = P2 H₂: P₁ P₂ 0

Algebra & Trigonometry with Analytic Geometry
13th Edition
ISBN:9781133382119
Author:Swokowski
Publisher:Swokowski
Chapter7: Analytic Trigonometry
Section7.2: Trigonometric Equations
Problem 100E

Related questions
Question
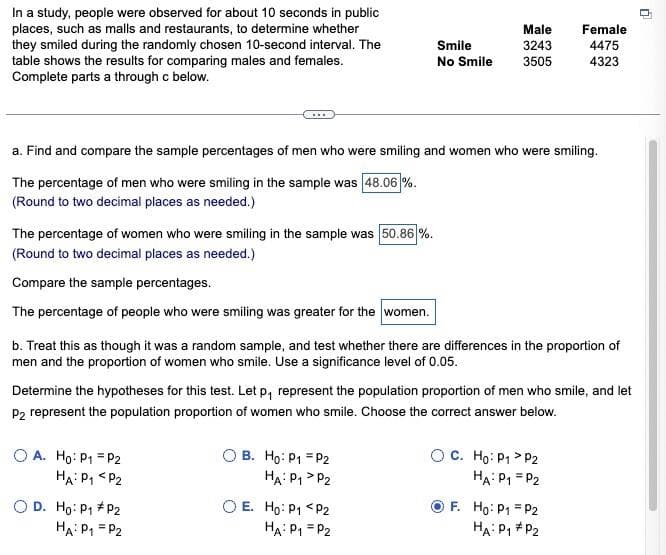
Transcribed Image Text:In a study, people were observed for about 10 seconds in public
places, such as malls and restaurants, to determine whether
they smiled during the randomly chosen 10-second interval. The
table shows the results for comparing males and females.
Complete parts a through c below.
The percentage of women who were smiling in the sample was 50.86 %.
(Round to two decimal places as needed.)
Compare the sample percentages.
The percentage of people who were smiling was greater for the women.
a. Find and compare the sample percentages of men who were smiling and women who were smiling.
The percentage of men who were smiling in the sample was 48.06 %.
(Round to two decimal places as needed.)
OA. Ho: P₁ P2
HA: P₁ P₂
Smile
No Smile
b. Treat this as though it was a random sample, and test whether there are differences in the proportion of
men and the proportion of women who smile. Use a significance level of 0.05.
O D. Ho: P₁ P2
HA: P₁ = P₂
Male
3243
3505
Determine the hypotheses for this test. Let p₁, represent the population proportion of men who smile, and let
P2 represent the population proportion of women who smile. Choose the correct answer below.
OB. Ho: P1 P2
HA: P1 P2
OE. Ho: P1 P2
HA: P1 P2
Female
4475
4323
OC. Ho: P1 P2
HA: P1 P2
F. Ho: P₁ = P2
HA: P1
P2
0
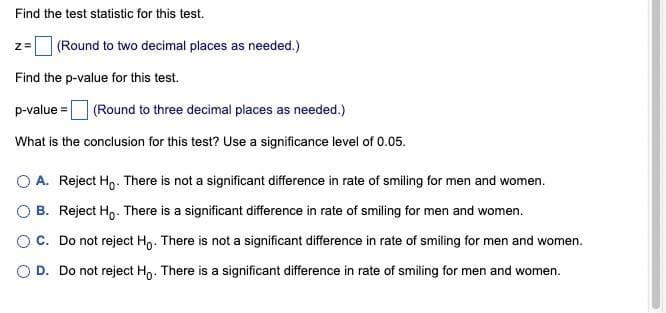
Transcribed Image Text:Find the test statistic for this test.
z =
(Round to two decimal places as needed.)
Find the p-value for this test.
p-value = (Round to three decimal places as needed.)
What is the conclusion for this test? Use a significance level of 0.05.
O A. Reject Ho. There is not a significant difference in rate of smiling for men and women.
OB. Reject Ho. There is a significant difference in rate of smiling for men and women.
OC. Do not reject Ho. There is not a significant difference in rate of smiling for men and women.
O D. Do not reject Ho. There is a significant difference in rate of smiling for men and women.
Expert Solution
This question has been solved!
Explore an expertly crafted, step-by-step solution for a thorough understanding of key concepts.

Step by step
Solved in 2 steps

Recommended textbooks for you
Algebra & Trigonometry with Analytic Geometry
Algebra
ISBN:
9781133382119
Author:
Swokowski
Publisher:
Cengage

Trigonometry (MindTap Course List)
Trigonometry
ISBN:
9781305652224
Author:
Charles P. McKeague, Mark D. Turner
Publisher:
Cengage Learning

Linear Algebra: A Modern Introduction
Algebra
ISBN:
9781285463247
Author:
David Poole
Publisher:
Cengage Learning
Algebra & Trigonometry with Analytic Geometry
Algebra
ISBN:
9781133382119
Author:
Swokowski
Publisher:
Cengage
Trigonometry (MindTap Course List)
Trigonometry
ISBN:
9781305652224
Author:
Charles P. McKeague, Mark D. Turner
Publisher:
Cengage Learning
Linear Algebra: A Modern Introduction
Algebra
ISBN:
9781285463247
Author:
David Poole
Publisher:
Cengage Learning