
MATLAB: An Introduction with Applications
6th Edition
ISBN: 9781119256830
Author: Amos Gilat
Publisher: John Wiley & Sons Inc
expand_more
expand_more
format_list_bulleted
Related questions
Question
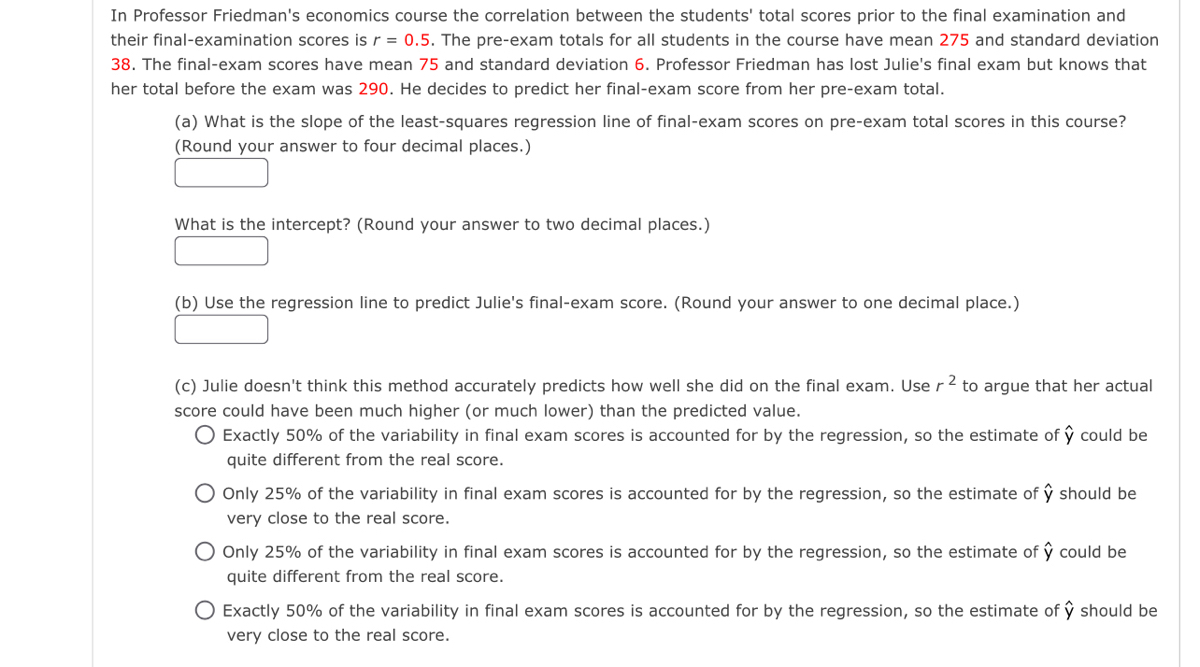

Transcribed Image Text:In Professor Friedman's economics course the correlation between the students' total scores prior to the final examination and
their final-examination scores is r = 0.5. The pre-exam totals for all students in the course have mean 275 and standard deviation
38. The final-exam scores have mean 75 and standard deviation 6. Professor Friedman has lost Julie's final exam but knows that
her total before the exam was 290. He decides to predict her final-exam score from her pre-exam total.
(a) What is the slope of the least-squares regression line of final-exam scores on pre-exam total scores in this course?
(Round your answer to four decimal places.)
What is the intercept? (Round your answer to two decimal places.)
(b) Use the regression line to predict Julie's final-exam score. (Round your answer to one decimal place.)
-2
(c) Julie doesn't think this method accurately predicts how well she did on the final exam. Use r² to argue that her actual
score could have been much higher (or much lower) than the predicted value.
O Exactly 50% of the variability in final exam scores is accounted for by the regression, so the estimate of ŷ could be
quite different from the real score.
O Only 25% of the variability in final exam scores is accounted for by the regression, so the estimate of ŷ should be
very close to the real score.
O Only 25% of the variability in final exam scores is accounted for by the regression, so the estimate of ŷ could be
quite different from the real score.
O Exactly 50% of the variability in final exam scores is accounted for by the regression, so the estimate of ŷ should be
very close to the real score.
Expert Solution
This question has been solved!
Explore an expertly crafted, step-by-step solution for a thorough understanding of key concepts.

This is a popular solution

Trending nowThis is a popular solution!

Step by stepSolved in 4 steps with 14 images

Knowledge Booster

Similar questions
- Lucille, Rocio, and Cristina are all taking College Mathematics but from different professors. They all recently took a statistics exam and the exam scores were normally distributed in each of their classes. Lucille's class had an average grade of 85 and the standard deviation was 3. Lucille earned 89.5 on the exam. Rocio's class had an average grade of 83 and the standard deviation was 4. Rocio earned 87.4 on the exam. Cristina's class had an average grade of 76 and the standard deviation was 6. Cristina earned 79.3 on the exam. Since some professors give harder exams than others, these students decided to use statistics to figure out who did the best on their exam.arrow_forwardLucas and Alex began arguing about who did better on their tests, but they couldn't decide who did better given that they took different tests. Lucas took a test in Math and earned a 73.4, and Alex took a test in English and earned a 70.5. Use the fact that all the students' test grades in the Math class had a mean of 74.1 and a standard deviation of 11.3, and all the students' test grades in English had a mean of 60.9 and a standard deviation of 8.1 to answer the following questions.a) Calculate the z-score for Lucas's test grade.z=z=b) Calculate the z-score for Alex's test grade.z=z=arrow_forwardThe blue catfish (Ictalurus Furcatus) is the largest species of North Amercian catfish. The current world record stands at 143 pounds, which was caught in the John H. Kerr Reservoir (Bugg's Island Lake) located in Virginia. According to Amercian Expedition, the average weight of a blue catfish is between 20 to 40 pounds. Given that the largest blue catfish ever caught was at the John H. Kerr Reservoir, you believe that the mean weight of the fish in this reservoir is greater than 40 pounds.a) If you going to test this claim at the 0.05 significance level, what would be your null and alternative hypotheses?H0H0: H1H1: b) What type of hypothesis test should you conduct (left-, right-, or two-tailed)? left-tailed right-tailed two-tailedarrow_forward
- What is the name of the test used?arrow_forwardThe blue catfish (Ictalurus Furcatus) is the largest species of North Amercian catfish. The current world record stands at 143 pounds, which was caught in the John H. Kerr Reservoir (Bugg's Island Lake) located in Virginia. According to Amercian Expedition, the average weight of a blue catfish is between 20 to 40 pounds. Given that the largest blue catfish ever caught was at the John H. Kerr Reservoir, you believe that the mean weight of the fish in this reservoir is greater than 40 pounds. Use the data below, which represents the summary statistics for 50 blue catfish caught at this reservoir, and a 0.05 significance level to test the claim that the mean weight of the fish in the John H. Kerr Reservoir is greater than 40 pounds. n=50; ¯x=40.72 pounds; s=5.03pounds Calculate your test statistic. Write the result below, and be sure to round your final answer to two decimal places.e) Calculate your p-value. Write the result below, and be sure to round your final answer to four decimal…arrow_forwardKyle and Caleb began arguing about who did better on their tests, but they couldn't decide who did better given that they took different tests. Kyle took a test in Math and earned a 73.9, and Caleb took a test in Art History and earned a 70.5. Use the fact that all the students' test grades in the Math class had a mean of 73 and a standard deviation of 9,4, and all the students' test grades in Art History had a mean of 62 and a standard deviation of 10.3 to answer the following questions. * a) Calculate the z-score for Kyle's test grade. = 2 b) Calculate the z-score for Caleb's test grade. c) Which person did relatively better? O Kyle O Caleb O They did equally well. MacBook Pro 00 000 esc F4 F5 F6 F7 F1 F2 F3 24 4 %23 tab caps lock C2arrow_forward
- The first statistics exam had a mean of 71 and a standard deviation of 11 points; the second had a mean of 84 and a standard deviation of 7 points. Anna scored a 84 on both tests. Megan scored 88 on the first exam and 80 on the second. They both totaled 168 points on the two exams, but Anna claims that her total is better. Explain. The total of Anna's z-scores is 0.6, which is greater than Megan's total of 1 (Round to one decimal place as needed.) 14 14 14. 143 144 145 146 147arrow_forwardDatabase A contains 40 data items and is made up with an equal number of the values of 0 and 100 and has a mean of 50. Database B also has 40 entries made up equally of the values 49 and51 and also has a mean of 50. Which database will have the smaller value for its standard deviation?arrow_forwardThe blue catfish (Ictalurus Furcatus) is the largest species of North Amercian catfish. The current world record stands at 143 pounds, which was caught in the John H. Kerr Reservoir (Bugg's Island Lake) located in Virginia. According to Amercian Expedition, the average weight of a blue catfish is between 20 to 40 pounds. Given that the largest blue catfish ever caught was at the John H. Kerr Reservoir, you believe that the mean weight of the fish in this reservoir is greater than 40 pounds. If you are going to test this claim, what would be your null and alternative hypotheses? Но: (? На: (?arrow_forward
- I collected data on levels of anxiety after receiving three types of therapies (CBT, psycho education, and psycho analysis). Below are the anxiety scores for 9 patients. Is there a difference in anxiety based on treatment type ? CBT: 3, 2, 0 Psycho Education: 8, 8, 9 Psycho Analysis: 10, 12, 12 (Look at the table)arrow_forwardRaul received a score of 77 on a history test for which the class mean was 70 with a standard deviation of 9. He received a score of 75 on a biology test for which the class mean was 70 with standard deviation 4. On which test did he do better relative to the rest of the classarrow_forwardSuppose Professor Alpha and Professor Omega each teach Introductory Biology. You need to decide which professor to take the class from and have just completed your Introductory Statistics course. Records obtained from past students indicate that students in Professor Alpha's class have a mean score of 80% with a standard deviation of 5%, while past students in Professor Omega's Class have a mean score of 80% with a standard deviation of 10%. Decide which instructor to take for Introductory Biology using a statistical argument.arrow_forward
arrow_back_ios
SEE MORE QUESTIONS
arrow_forward_ios
Recommended textbooks for you
- MATLAB: An Introduction with ApplicationsStatisticsISBN:9781119256830Author:Amos GilatPublisher:John Wiley & Sons Inc
 Probability and Statistics for Engineering and th...StatisticsISBN:9781305251809Author:Jay L. DevorePublisher:Cengage Learning
 Statistics for The Behavioral Sciences (MindTap C...StatisticsISBN:9781305504912Author:Frederick J Gravetter, Larry B. WallnauPublisher:Cengage Learning
  Elementary Statistics: Picturing the World (7th E...StatisticsISBN:9780134683416Author:Ron Larson, Betsy FarberPublisher:PEARSON
 The Basic Practice of StatisticsStatisticsISBN:9781319042578Author:David S. Moore, William I. Notz, Michael A. FlignerPublisher:W. H. Freeman
 Introduction to the Practice of StatisticsStatisticsISBN:9781319013387Author:David S. Moore, George P. McCabe, Bruce A. CraigPublisher:W. H. Freeman
MATLAB: An Introduction with Applications
Statistics
ISBN:9781119256830
Author:Amos Gilat
Publisher:John Wiley & Sons Inc
Probability and Statistics for Engineering and th...
Statistics
ISBN:9781305251809
Author:Jay L. Devore
Publisher:Cengage Learning
Statistics for The Behavioral Sciences (MindTap C...
Statistics
ISBN:9781305504912
Author:Frederick J Gravetter, Larry B. Wallnau
Publisher:Cengage Learning
Elementary Statistics: Picturing the World (7th E...
Statistics
ISBN:9780134683416
Author:Ron Larson, Betsy Farber
Publisher:PEARSON
The Basic Practice of Statistics
Statistics
ISBN:9781319042578
Author:David S. Moore, William I. Notz, Michael A. Fligner
Publisher:W. H. Freeman
Introduction to the Practice of Statistics
Statistics
ISBN:9781319013387
Author:David S. Moore, George P. McCabe, Bruce A. Craig
Publisher:W. H. Freeman