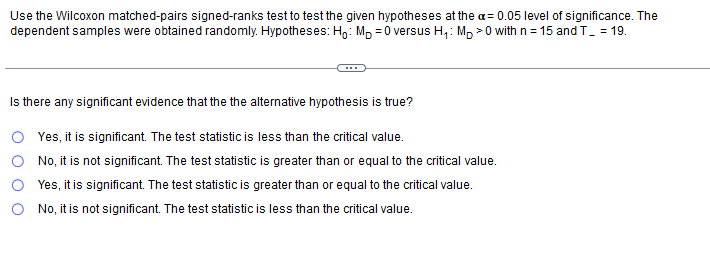
Is there any significant evidence that the the alternative hypothesis is true?


Q: Find the sample size needed from Grade 11 students with margin of error 5% and each strata has the…
A: From the provided information, Margin of error (E) = 5% = 0.05 The population are as follow: STEM…
Q: The quantity is the -Select- -Select-- v ✓, while the quantity is the ---Select--- ✓of all possible…
A: Answer:- We know that, Population mean = μ ; Population standard deviation = σ Mean of all possible…
Q: Assume that females have pulse rates that are normally distributed with a mean of μ = 76.0 beats per…
A: We have given information, Let X= females pulse rates. Assuming the random variable X follows a…
Q: Recent records shows that 65 % of students in a learning institution consider themselves above…
A: It is given that n=8 and p=0.65.
Q: A die is tossed once. What is the probability that it will be 4 or divisible by 2
A: A die is tossed once. sample space:{1,2,3,4,5,6}total outcomes=6 outcomes probability that it will…
Q: Consider the following optimization problem: min X + 2Y s.t. 3X+Y≤ 10 After solving it, the optimal…
A: Optimization problems are a common tool in many fields, including economics, engineering, and…
Q: K The accompanying table describes results from groups of 8 births from 8 different sets of parents.…
A: All the related information are in the question. a) Here, we have to find the probability of…
Q: What type of pattern exists? The time series plot shows a cyclical pattern. The time series plot…
A: a) Time series Plot: Excel Procedure: Enter the data for Period and Price in Excel sheet Select the…
Q: Measurements of the speed of light are given in the table. Estimate the speed of light using a 90%…
A:
Q: 12. Calculate the following probabilities using the corresponding table. Experimental distribution…
A:
Q: A statistical program is recommended. A certain company has been an authorized dealer for C&D marine…
A: Introduction: Denote the time series value for a particular quarter corresponding to time point t,…
Q: Engineers want to design seats in commercial aircraft so that they are wide enough to fit 90% of all…
A: Given that: Mean, μ=14.2 Standard deviation, σ=1.1
Q: 201 venue ($ billions) 1 ~ 4 5 in 9 10 (a) Construct a time-series plot. (5 billions) $20.80 $22.65…
A: here we have to use excel : enter data in excel clickon insert click to scatter
Q: Let X be a random variable that follows the normal with mean of 80 and variance 49. d) Find ?x such…
A: We have given, Let X be a random variable that follows the normal distribution. The mean of μ=80…
Q: Consider a population consisting of the following five values, which represent the number of video…
A: Hi thank you for posting this question , since you have posted multiple subparts as per our…
Q: (b) Use the quadratic regression feature of a graphing calculator to get a quadratic function that…
A: The question is about regression Given : To find : Quadratic function using graphing calculator
Q: A survey found that women's heights are normally distributed with mean 63.6 in and standard…
A: Given Information: Mean μ=63.6 Standard deviation σ=2.5 A branch of the military requires women's…
Q: a. Calculate the distribution of answers to Q5 [Were both of your parents born in the US?], showing…
A: Given information: D Q5 Q12 1 2 2 2 2 3 3 2 2 4 1 1 5 1 1 6 1 1 7 1 2 8 1 2 9 2…
Q: How can I make a model between two variables with an exponential relation between them in R-Studio…
A: Here are the steps to create a new R Markdown file: Open R Studio. Click on "File" in the menu bar.…
Q: Given the following frequency table, calculate the mean of X. (Please round your answer to 2…
A: x f 13 1 14 4 15 2 16 1 17 2 mean = ?
Q: A professor is interested in assessing the efficacy of a new tutoring service offered by their…
A: The data shows two test scores for 10 students.
Q: In this exercise, a randomization distribution is given for a hypothesis test, and shows what values…
A: Given: To answer the questions, we need to compare the given sample statistic (p^=0.6 for part a and…
Q: 9. The relationship between confidence intervals and hypothesis testing In an effort to better…
A: 9) Answer:- Given, Hypotheses are, H0 : µ1 -µ2 = 0 H1 : µ1 -µ2 ≠ 0 The 99% confidence interval is…
Q: John is 6 feet 2 inches tall. What measurement scale is this?
A: Given: John is 6 feet 2 inches.
Q: Find the area of the shaded region. The graph depicts the standard normal distribution with mean 0…
A: Given, The graph depicts the standard normal distribution with mean 0 and standard deviation 1. We…
Q: Below is a graph of a normal distribution with mean μ = 1 and standard deviation o=3. The shaded…
A: Given: The first graph indicates a normal distribution with mean μ=1 and standard deviation σ=3. The…
Q: A marketing researcher is interested in estimating the proportion of customers who favour/do not…
A: The proportion of customers who favour cola over other soft drinks is 0.53.
Q: In the city of Milford, applications for zoning changes go through a two-step process: a review by…
A: a) There are total two steps in the experiment.
Q: A statistics professor plans classes so carefully that the lengths of her classes are uniformly…
A: From given length of class are uniformly disttibuted with a=45 , b-55 so, f(x)=1b-a=155-45=110…
Q: 6. Let W = Yu, where Y~n(μ, o²). Find the moment-generating function of W. 1
A: Solution
Q: When women were finally allowed to become pilots of fighter jets, engineers needed to redesign the…
A: The question is about normal distribution Given : Popl. mean weight of women ( μ ) = 170 lb Popl.…
Q: In a recent year, an author wrote 194 checks. Use the Poisson distribution to find the probability…
A:
Q: The forecast for each week of a four-week schedule is 50 units. The MPS rule is to schedule…
A: Given information: The data represents the forecast for each week of a four-week schedule.
Q: A company surveyed 2,600 North American airline passengers and reported that approximately 70% said…
A: given data n= 10 p = 0.7x = no. of favorable outcomesP(x=X) = nCxpxqn-x______binomial distribution
Q: the following questions, THERE IS NO NEED FOR EXPLANATION. PLEASE PROVIDE JUST THE ANSWER THANK YOU.…
A: We have to determine which statement is true for given situation.
Q: The results of a national survey showed that on average, adults sleep 6.7 hours per night. Suppose…
A: Note- Since you have posted multiple questions, as per our guidelines we are supposed to answer only…
Q: Census data for the United States between 1790 and 1950 are given in the table above. Construct a…
A: Given information: Given data represents the values of the variables year and population (in…
Q: Exercise 14. Let X₁, X2, X3 be independent Bernoulli trials, i.e. the X, are i.i.d. random variables…
A: Given that: X1, X2, X3 are independent bernoulli trials. PXi=1=p and PXi=0=1-p Null Hypothesis…
Q: Could the explanation of how each cardinality set is determined be described?
A: Cardinality : It is the number of elements in a mathematical set. In question there are three…
Q: Q14. Choose the statement that best matches the conclusion of your two-tailed paired t test. Your…
A: Given that Choose the statement that best matches the conclusion of your two-tailed paired t test.…
Q: For the following questions, THERE IS NO NEED FOR EXPLANATION. PLEASE PROVIDE JUST THE ANSWER THANK…
A: We have to determine which statement is true for given situation.
Q: Here is a probability distribution: X 2 4 7 10 P(X) 0.3 0.05 0.3 0.35 Find the mean of this…
A: Solution-: We have given following probability distribution: X P(X) 2 0.3 4 0.05 7 0.3…
Q: The Data Represents the ages of 40 women when they each had a boyfriend. Construct a grouped…
A: minimum :13maximum:27n=40no. of class=5class width:=maximum-minimumno. of class=27-135=2.8≃3
Q: The economic dynamism, which is the index of productive growth in dollars for countrie that are…
A: It is given that the middle income of 27 countries which are designated by the world bank. We need…
Q: Exercise 12. Let X, Y, Z ~ N(0, 1) be independent. Determine the distribution, expectation and…
A: 12) Given that X, Y, Z ~ N(0,1). Here X, Y and Z are independent random variables.
Q: Assume that a randomly selected subject is given a bone density test. Those test scores are normally…
A: Here the given information is Assume that a randomly selected subject is given a bone density test.…
Q: The data in the accompanying table represent the heights and weights of a random sample of…
A: The data table provided in the question is as follows : Height Weight 75 227 75 195 72 180…
Q: A study indicates that 73% of singles have have tried online dating. You randomly sample 5 singles.…
A: This is a binomial distribution problem, the probability of success p=0.73
Q: 6 Sales at a fast-food restaurant average $6,500 per day. The restaurant decided to introduce an…
A: Given Population mean, μ= $6,500 Population standard deviation, σ = $1,000 Sample mean, x= $6,600…
Q: You may need to use the appropriate appendix table or technology to answer this question. After…
A: Note: Hi there! Thank you for posting the questions. As there are multiple sub parts, according to…

Step by step
Solved in 2 steps

- A simple random sample of front-seat occupants involved in car crashes was obtained. Among 7,000 occupants not wearing seat belts, 18were killed. Among 7765 occupants wearing seat belts, 16 were killed. Use a 0.01 significance level to test the claim that seat belts are effective in reducing fatalities using the critical value approach. a) Define parameters and state null and alternative hypothesis. b)Test statistics c) P-value d) ConclusionA student-researcher claims that the difference between the proportion of male athletes and that of female athletes in a certain university who live in Makati is far from 7.25%. 285 male athletes have been selected at random, and 113 of them reside in Makati. On the other hand, 171 female athletes have been chosen as samples, and 67 of them are from Makati as well. At alpha = 0.01, is there sufficient evidence to support the student-researcher’s claim? (Critical value approach)It is desired to test the claim that a steady diet of wolfbane will cause a lycanthrope (werewolf) to lose 10 lbs. over 5 months. A random sample of 56 lycanthropes was taken yielding an average weight loss over 5 months of 12.5 pounds, with S = 7 lbs. Identify the critical value suitable for conducting a two-tail test of the hypothesis at the 5% level.
- A random sample of 10 secretaries was asked to type a certain memorandum using both computers and typewriters, and the time required to finish the task was recorded for each secretary. A test of hypothesis will be conducted to determine if there is enough evidence to conclude that the average time required to type a certain memorandum is faster if female secretaries are using computers rather than typewriters using a 5% level of significance. What are the critical value(s) that will be used in the conduct of the above test of hypothese a)1.812 b)2.262 c)1.8331 d)1.960 I know the options B and D are wrong but I cant get the correct answer. I need help in solving to the right optionA manufacturer is developing a nickel-metal hydride battery to be used in cellular telephones instead of a nickel-cadmium battery. The director of quality control decides to evaluate the newly developed battery by picking a random sample of employees with cellular phones and asking them to use both phones until the batteries run down. The results are given in the excel data file. At the 5% level of significance is there evidence that the new battery provides more minutes of talk time per battery charge? Show your work and give your answer in complete sentences in context of the problem. Data Table: Person Old Battery Type New Battery Type 1 72.39 89.95 2 75.25 64.60 3 82.10 71.25 4 58.98 87.07 5 67.07 103.11 6 35.98 76.46 7 75.37 83.92 8 66.00 83.42 9 73.14 84.30 10 67.14 92.48 11 83.06 93.48 12 57.00 59.11 13 65.92 92.27 14 76.12 61.81 15 85.21 72.83 16 80.73 42.17 17 60.65 83.89 18 36.63 94.41 19 77.98 70.30 20 75.40 77.72 21 84.70 84.35…Only 20% of registered voters voted in the last election. Will voter participation decline for the upcoming election? Of the 374 randomly selected registered voters surveyed, 71 of them will vote in the upcoming election. What can be concluded at the αα = 0.01 level of significance? The p-value is ? ≤ > αα Based on this, we should Select an answer reject fail to reject accept the null hypothesis. Thus, the final conclusion is that ... The data suggest the population proportion is not significantly lower than 20% at αα = 0.01, so there is statistically insignificant evidence to conclude that the percentage of registered voters who will vote in the upcoming election will be lower than 20%. The data suggest the populaton proportion is significantly lower than 20% at αα = 0.01, so there is statistically significant evidence to conclude that the the percentage of all registered voters who will vote in the upcoming election will be lower than 20%. The data suggest the population…
- A researcher claims that the difference between the proportion of male athletes and that of female athletes in a certain university who live in osaka is far from 7.25%. 285 male athletes have been selected at random, and 113 of them reside in osaka. On the other hand, 171 female athletes have been chosen as samples, and 67 of them are from osaka as well. At alpha = 0.01, is there sufficient evidence to support the student-researcher’s claim? (use Critical value approach)A random sample of 100 male employees showed that 42 are working from home while a random sample of 100 female employees showed that 63 are working from home. Are the two population proportions equal? Test at alpha=0.05. What is Ho and Ha? And what is the test statistic value for this test? Based on the test statistic value, what is your decision?A comprehensive trial investigating the relationship between vitamin E supplementation and reduced risk for prostate cancer was carried out across the US. Suppose the trial reported that among the 648 patients receiving the supplement program, 267 developed prostate cancer, while only 212 of the 711 patients without the supplementation developed the disease. Carry out a formal test to determine if there is a significant difference in the risk for developing prostate cancer among the two groups. Write out your null and alternative hypotheses and use an alpha level of 0.05. Also, Comment on the effectiveness of the supplementation at reducing prostate cancer. What did you find relevant to the research hypothesis?
- Follow the steps in Test of Hypothesis including your conclusion and round off the critical value and test statistic into 4 decimal places Two suppliers manufacture a plastic gear used in a laser printer. The impact strength of these gears measures in foot-pounds is an important characteristic. A random sample of 10 gears from supplier 1 results in x1 = 290 and s1 = 12 while another random sample of 16 gears from the second supplier results in x2 = 321 and s2 = 22. Is there evidence to support the claim that supplier 2 provides gears with higher mean impact strength. Use a =0.04, and assume that both populations are normally distributed with equal variances.The owner of a fine-dining restaurant claims that at least 72% of their customers are giving huge amounts of tips after dining. A random sample of 470 customers have been observed, and 329 of them gave huge amounts of tips. At alpha = 0.02, is there sufficient evidence to support the owner’s claim? Use the critical-value approach.A company manufacturing computer chips finds that 8% of all chips manufactured are defective. Management is concerned that high employee turnover is partially responsible for the high defect rate. In an effort to decrease the percentage of defective chips, management decides to provide additional training to those employees hired within the last year. After training was implemented, a sample of 450 chips revealed only 27 defects. If the P-value associated with the test statistic is 0.0594, At Alpha = 0.01, We can conclude that the additional training significantly lowered the defect rate We can conclude that the additional training did not significantly lower the defect rate We can conclude that the additional training significantly increased the defect rate We can conclude that the additional training did not affect the defect rate


