Let X be a Poisson random variable with mean λ = 20. Estimate the probability P(X ≥25) based on: (a) Markov inequality. (b) Chebyshev inequality. (c) Chernoff bound. (d) Central limit theorem.
Let X be a Poisson random variable with mean λ = 20. Estimate the probability P(X ≥25) based on: (a) Markov inequality. (b) Chebyshev inequality. (c) Chernoff bound. (d) Central limit theorem.

Algebra & Trigonometry with Analytic Geometry
13th Edition
ISBN:9781133382119
Author:Swokowski
Publisher:Swokowski
Chapter10: Sequences, Series, And Probability
Section10.8: Probability
Problem 19E

Related questions
Question
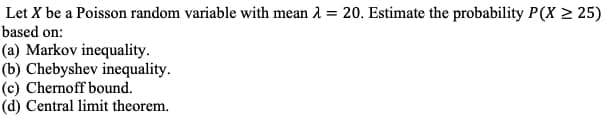
Transcribed Image Text:Let X be a Poisson random variable with mean λ = 20. Estimate the probability P(X ≥25)
based on:
(a) Markov inequality.
(b) Chebyshev inequality.
(c) Chernoff bound.
(d) Central limit theorem.
Expert Solution
This question has been solved!
Explore an expertly crafted, step-by-step solution for a thorough understanding of key concepts.

This is a popular solution!

Trending now
This is a popular solution!

Step by step
Solved in 2 steps

Recommended textbooks for you
Algebra & Trigonometry with Analytic Geometry
Algebra
ISBN:
9781133382119
Author:
Swokowski
Publisher:
Cengage

Linear Algebra: A Modern Introduction
Algebra
ISBN:
9781285463247
Author:
David Poole
Publisher:
Cengage Learning
Algebra & Trigonometry with Analytic Geometry
Algebra
ISBN:
9781133382119
Author:
Swokowski
Publisher:
Cengage
Linear Algebra: A Modern Introduction
Algebra
ISBN:
9781285463247
Author:
David Poole
Publisher:
Cengage Learning