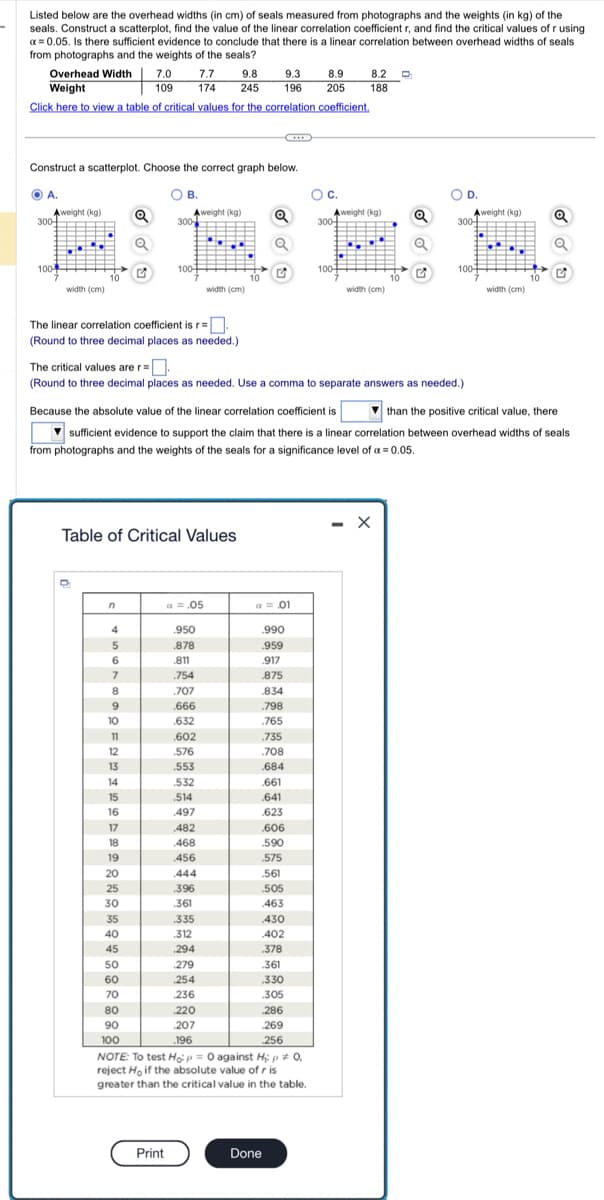
Listed below are the overhead widths (in cm) of seals measured from photographs and the weights (in kg) of the seals. Construct a scatterplot, find the value of the linear correlation coefficient r, and find the critical values of r using a = 0.05. Is there sufficient evidence to conclude that there is a linear correlation between overhead widths of seals from photographs and the weights of the seals? Overhead Width 7.0 Weight Click here to view a table of critical values for the correlation coefficient. A. Construct a scatterplot. Choose the correct graph below. O C. Aweight (kg) Q Aweight (kg) Q 300- REFE 100- 300 100 Aweight (kg) Q 7.7 9.8 109 174 245 width (cm) B. 300- 100- 9.3 8.9 8.2 196 205 188 width (cm) width (cm) O D. 300 Aweight (kg) Q 100- width (cm)
Listed below are the overhead widths (in cm) of seals measured from photographs and the weights (in kg) of the seals. Construct a scatterplot, find the value of the linear correlation coefficient r, and find the critical values of r using a = 0.05. Is there sufficient evidence to conclude that there is a linear correlation between overhead widths of seals from photographs and the weights of the seals? Overhead Width 7.0 Weight Click here to view a table of critical values for the correlation coefficient. A. Construct a scatterplot. Choose the correct graph below. O C. Aweight (kg) Q Aweight (kg) Q 300- REFE 100- 300 100 Aweight (kg) Q 7.7 9.8 109 174 245 width (cm) B. 300- 100- 9.3 8.9 8.2 196 205 188 width (cm) width (cm) O D. 300 Aweight (kg) Q 100- width (cm)

Glencoe Algebra 1, Student Edition, 9780079039897, 0079039898, 2018
18th Edition
ISBN:9780079039897
Author:Carter
Publisher:Carter
Chapter4: Equations Of Linear Functions
Section4.5: Correlation And Causation
Problem 11PPS

Related questions
Question
Transcribed Image Text:Listed below are the overhead widths (in cm) of seals measured from photographs and the weights (in kg) of the
seals. Construct a scatterplot, find the value of the linear correlation coefficient r, and find the critical values of r using
x=0.05. Is there sufficient evidence to conclude that there is a linear correlation between overhead widths of seals
from photographs and the weights of the seals?
Overhead Width 7.0
Weight
109
Click here to view a table of critical values for the correlation coefficient.
A.
Construct a scatterplot. Choose the correct graph below.
OB.
Aweight (kg)
=======
+++++
300
100
PL
===
▬▬▬▬▬
width (cm)
10
4
5
6
7
8
9
10
11
Q
Q
The linear correlation coefficient is r=.
(Round to three decimal places as needed.)
12
13
14
14
15
16
17
18
19
20
25
30
P
35
40
45
50
60
70
Table of Critical Values
80
90
100
Aweight (kg)
======
S▬▬▬▬▬▬▬
POSO
300
100+
Print
7.7 9.8
174 245
a = .05
.950
.878
.811
.754
.707
.666
.632
.602
.576
.553
532
.514
497
482
468
456
444
.396
.361
.335
.312
width (cm)
294
279
The critical values are r=
(Round to three decimal places as needed. Use a comma to separate answers as needed.)
254
236
.220
207
.196
9.3 8.9
196 205
Q
O
a = .01
.990
.959
.917
.875
.834
.798
.765
Because the absolute value of the linear correlation coefficient is
than the positive critical value, there
sufficient evidence to support the claim that there is a linear correlation between overhead widths of seals
from photographs and the weights of the seals for a significance level of x = 0.05.
.735
.708
.684
.661
.641
.623
.606
.590
.575
.561
.505
463
Done
.430
450
402
.378
361
330
.305
286
269
256
NOTE: To test Ho: P = 0 against H; p = 0,
reject Ho if the absolute value of ris
greater than the critical value in the table.
O C.
300
Aweight (kg)
▪=====
H▬▬▬▬▬
COMO
●▬====
===
100-1
8.2 D
188
width (cm)
10
- X
Q
Q
G
OD.
300
100
Aweight (kg)
1. ▬▬▬▬
T
TH
----O
width (cm)
10
Q
O
G
Expert Solution
This question has been solved!
Explore an expertly crafted, step-by-step solution for a thorough understanding of key concepts.

Step by step
Solved in 3 steps with 2 images

Recommended textbooks for you
Glencoe Algebra 1, Student Edition, 9780079039897…
Algebra
ISBN:
9780079039897
Author:
Carter
Publisher:
McGraw Hill

Big Ideas Math A Bridge To Success Algebra 1: Stu…
Algebra
ISBN:
9781680331141
Author:
HOUGHTON MIFFLIN HARCOURT
Publisher:
Houghton Mifflin Harcourt
Glencoe Algebra 1, Student Edition, 9780079039897…
Algebra
ISBN:
9780079039897
Author:
Carter
Publisher:
McGraw Hill
Big Ideas Math A Bridge To Success Algebra 1: Stu…
Algebra
ISBN:
9781680331141
Author:
HOUGHTON MIFFLIN HARCOURT
Publisher:
Houghton Mifflin Harcourt