Macmillan Learning 
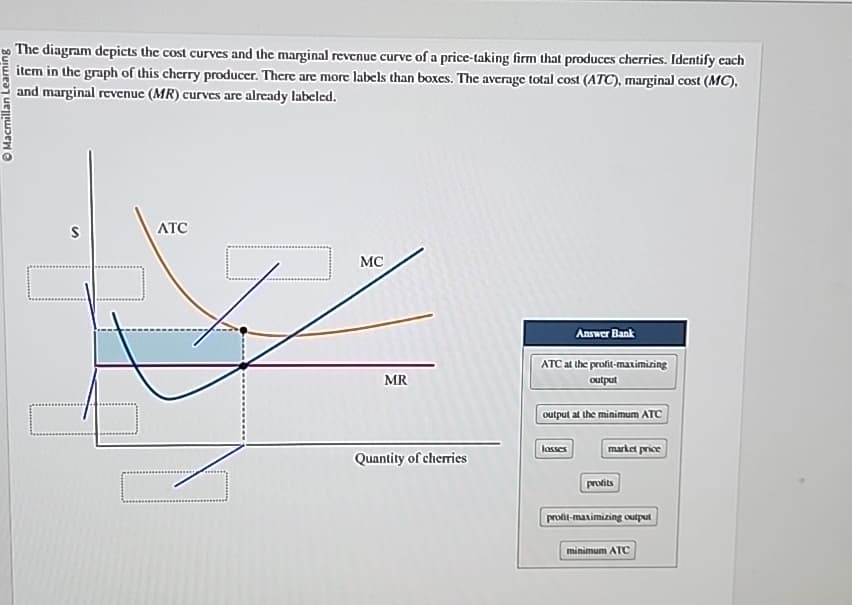
The diagram depicts the cost curves and the marginal revenue curve of a price-taking firm that produces cherries. Identify each item in the graph of this cherry producer. There are more labels than boxes. The average total cost (ATC), marginal cost (MC), and marginal revenue (MR) curves are already labeled. S ATC MC MR Answer Bank ATC at the profit-maximizing output output at the minimum ATC Josses market price Quantity of cherries profits profit-maximizing output minimum ATC
Q: Price Level AD1 AD₂ AD2 Real Domestic Output, GDP Refer to the accompanying graph. What combination…
A: Here is my response: The correct answer is not a combination of an increase in taxes and an increase…
Q: A multinational Corporation based in the United States of America has subsidiaries in the UK,…
A: The exchange rates in the international market are defined as the rates at which one currency in the…
Q: None
A: Approach to solving the question: To tackle the question, the approach involved initially grasping…
Q: Econ question: a.Explain and show the impact on the money market when the Federal Reserve lowers the…
A: Certainly! When the Federal Reserve lowers the interest rate on bank reserves (IORB), it leads…
Q: You are in charge of improving utilization of resources at a restaurant that is taking only online…
A: Resource utilization becomes efficient when the minimum use of resources accrues the maximum…
Q: Game theory is: O a view on the development of children's games and toys. O the analysis of market…
A: Game theory is a branch of economics that analyzes strategic interactions among rational…
Q: Given the two functions below: Y=10e-0.5q and y=7ln5q Draw the two functions for the interval…
A: The demand function refers to a mathematical representation of the relationship between the quantity…
Q: Asaaap
A: The Nash equilibria of the game are (A, 1), (B, 3), (C, 4), and (D, 2).The subgame-perfect…
Q: Consider the following diagram for a natural monopoly. $ 50 40 40 30 20 18 10 ATC MC D 5 8 10 12 16…
A: C) How much deadweight loss would a single-price monopolist create?The deadweight loss created by a…
Q: Cost (dollars) 150 100 50 0 5 10 D $15 20 B Output (teapots per day) 5. Refer to Figure above. Which…
A: A. The vertical gap between curves B and C is equal to average variable cost. [FALSE]The vertical…
Q: ABC Inc. maintains a defined contribution plan permitting employees to make an annual contribution…
A: Step 1: Given Value for Calculation Annual Payment = p = $35,000Annual Rate of Return = r = 8%Number…
Q: Quantity of Total Product Output Cost Price 0 $250 $300 1 260 250 2 290 200 3 350 150 4 480 100 50…
A: Step 1: Answer: To find out how much profit the monopolist will earn when practicing price…
Q: Evaluate the following Since a rival s profit maximizing price Evaluate the following: “Since a…
A: Profit is the earnings or financial benefit of an individual or firm in doing business. The firm…
Q: Costs in the short run versus in the long run Scooter’s Scooters is a large American manufacturer of…
A: To answer the questions, we will be looking at the table provided.In question 1, Scooter's Scooters…
Q: The following graph characterizes a firm in a monopolistically competitive market. ATC 32 24 8 MC…
A: Justification for Option C (Short Run Position):The given information does not specify whether the…
Q: Asaaap
A: Given the player's preferences, we can assign the following utilities to the outcomes:OutcomeAmy's…
Q: The elasticity of substitution of a Cobb-Douglas production function is constant alongthe whole…
A: i hope you got the concept. if you feel like having any doubt in any part of the question then feel…
Q: ou want to save the down payment required to purchase a vacation home at the end of four years. If…
A: The amount you want to set aside at the end of year which is same amount is the concept of ordinary…
Q: (c) Graph the Engel curve for good z from Y = $0 to Y = $100 given P = $8 and P = $1. Hint: there…
A: A utility function represents a consumer’s preferences for a set of goods and services…
Q: Game theory is: O a view on the development of children's games and toys. O the analysis of market…
A: Game theory is the science of analyzing strategic interactions between rational decision-makers. It…
Q: Keynesian Liquidity Preference Theory and Its Relevance to the Caribbean Region •Outline the main…
A: Keynesian Liquidity Preference Theory's Core Ideas John Maynard Keynes developed the Keynesian…
Q: please give me correct answer with drawing graph otherwise give Downvote
A:
Q: Auria will produce a vehicle component and knows that each start generates a cost of 5,000 pesos.…
A: The total annual cost of the business means the expense incurred by the business for buying,…
Q: The graph below depicts an economy where a decline in aggregate demand has caused a recession.…
A: Step 1: A multiplier concept in economics indicates that a change in one economic factor triggers…
Q: 3. Shift in Demand right and left caused by TIRES 4. Shift in Supply right and left caused by TIGERS…
A: Demand to shift to the right:When the demand for a product or service increases, it causes the…
Q: Asaaap
A: QUESTION aA proper subgame is any subgame that starts at a decision node that is not the initial…
Q: Give exact proper explanation answer and take like
A: The inflation rate is how much the price of a good (in this case we are using CPI) has increased or…
Q: 1. Assume that a survey of households revealed that the non-institutional population 16 years and…
A: Unemployment refers to a situation in which individuals who belong to the working age population,…
Q: The great expert Hand written solution is not allowed please.
A: i hope you got the concept. if you feel like having any doubt in any part of the question then feel…
Q: None
A: The American central banking system is called the Federal Reserve, or simply the Fed. Its main…
Q: None
A: Explanation is as follows:The sticky-wage theory suggests that in the short-run, nominal wages (the…
Q: Consider the following information for the financial asset H. State of the World Probability of…
A: The above answer can be explained as under - Expected return for Asset H = Probability of…
Q: Refer to Figure 6.3. On this graph, area BCEO represents: OA. producer surplus. OB. total surplus…
A: In the given figure, the x-axis represents the quantity of a good or service, and the y-axis…
Q: 3. The effect of negative externalities on the optimal quantity of consumption Consider the market…
A: Ans. ) Given the question, where the market for electricity is considered. Here a power plant dumps…
Q: A solid waste disposal company borrowed money at 10% per year interest to purchase new equipment…
A: The objective of the question is to identify the engineering economy symbols and their values, draw…
Q: In a mechanical drive system, what effect does inefficiency have on the output when compared to the…
A: In a mechanical drive system, efficiency refers to how effectively it converts input energy into…
Q: If agriculture accounts for $4,000, industries $5,000 and services $7,000 of total output, determine…
A: The objective of the question is to calculate the sectorial shares in gross output of the three…
Q: e. A firm in a given industry has an incentive to use the new technology if and only if the expected…
A: Industrial economics is a branch of economics in which industrial matters are analyzed with the help…
Q: Expert sir asaap answer
A: Option a: This option is correct (a) The pure strategy Nash equilibria can be Pareto ranked.Players…
Q: 1. Consider Spence job market signaling model. A worker's type is 0 = {6, 9}, where the probability…
A:
Q: PRICE LEVEL Show the long-run effect of this change according to the monetarist view, ceteris…
A: PART 1According to the monetarist point of view, an increase in the money supply will, in the long…
Q: Using the utility-maximization rule as your point of reference, explain the income and substitution…
A: The utility is measured ordinally through the indifference (IC) curve approach.The IC is a locus of…
Q: Aggregate expenditure (billions of 2007 dollars) 375 347 150 100 10 0 100 200 45° line AE C 300 375…
A: The link between aggregate expenditure, or total spending, and real GDP is seen in this graph. The…
Q: Consider a Cournot duopoly with the inverse demand P = 260 2Q. Two Örms compete choosing their…
A: The objective of the question is to find the best response function for each firm, the Cournot…
Q: 3. Answer all parts of this question. (a) Suppose that the central bank is at its bliss point where…
A: “Since you have asked multiple questions, we will solve the first question for you. If you want any…
Q: The beautiful expert Hand written solution is not allowed.
A: Approach to solving the question: Step 1: Identify the relevant cash flows for the defender (current…
Q: You are evaluating a project that will require an investment of $15 million that will be…
A: for my satisfaction, here are some more explanations. Please read first let's consider a project…
Q: Marryweather Ltd. is a company that sells machines in the US and the EU. The inverse demand…
A: Demand measures the willingness and the ability of the individual to pay for the commodity. The…
Q: PROBLEM 3 – Slutsky Equation, Income Effect, Substitution Effect, and Total Effect There are two…
A: Slutsky equation states that the total change in the demand consists of the income and substitution…
Q: None
A: Analyzing Van Replacement with Goal SeekWe can use Goal Seek to find the market value of the current…
Trending now
This is a popular solution!
Step by step
Solved in 2 steps with 2 images
- What two lines on a cost curve diagram intersect at the zero-profit point?Based on your answers to the WipeOut Ski Company in Exercise 7.3, now imagine a situation where the firm produces a quantity of 5 units that it sells for a price of 25 each. What will be the companys profits or losses? How can you tell at a glance whether the company is making or losing money at this price by looking at average cost? At the given quantity and price, is the marginal unit produced adding to profits?A firms marginal cost curve above the average variable cost curve is equal to the films individual supply curve. This means that every time a firm receives a price from the market it will be willing to supply the amount of output where the price equals marginal cost. What happens to the films individual supply curve if marginal costs increase?
- The accompanying table shows a car manufacturer’s total cost of producing cars.a) What is thismanufacturer’s fixed cost?b) For each level of output, calculate the variable cost (VC). For each level of outputexcept zero output, calculate the average variable cost (AVC), average total cost(ATC), and average fixed cost (AFC). What is the minimum-cost output?c) For each level of output, calculate this manufacturer’s marginal cost (MC).d) On one diagram, draw the manufacturer’s AVC, ATC, and MC curves.2. Labor costs represent a large percentage of total costs for many firms. According to data fromthe Bureau of Labor Statistics, U.S. labor costs were up 2.0% in 2019, compared to 2018.a) When labor costs increase, what happens to average total cost and marginal cost?Consider a case in which labor costs are only variable costs and a case in which theyare both variable and fixed costs.An increase in labor productivity means each worker can produce more output. Recent data onproductivity show…Henry Potter owns the only wcU in town that pro-ducesclean drinking water. He faces the follO\\•ingdemand, marginal revenue, and marginal cost curves:Demand: P • 70 - QMarginal Revenue: MR • 70 - 2Q~arginal Cost: MC • lO + Qa. Graph these three curves. Assuming thatMr. Potter maximizes profit, what quantity docshe produce? What prioc does he charge? Showthese rcsuiiS on your graph.b. Mayor George Bailey, concerned about water con~sumcrs_. is considering a price ceiling that is10 percent below the monopoly price derived inpart (a). What quantity would be demanded atthis new price? Would the profit-maximizingMr. Potter produce that amount? Explain. (Hi11t:1hink about marginal cost.)c. George's Uncle Billy says that a price ceiling is abad idea because price ceilings cause shortages.Is he right in this case? What size shortage wouldthe prioc ociling create? Explain.d. George's friend Clarence, who is even more con~cerncd about consumers, suggests a price ceiling50 percent below the…Suppose that each firm in a competitive industry has thefollowing costs: Total cost: TC=50 + 1/2q^2 Marginal cost: MC=q where q is an individual firm’s quantity produced. The marketdemand curve for this product is Demand: QD = 120 – P where P is the price and Q is the total quantity of the good.Currently, there are 9 firms in the market. a. What is each firm’s fixed cost? What is its variable cost?Give the equation for average total cost. b. Graph average total cost curve and the marginal cost curvefor q from 5 to 15. At what quantity is average total cost curve atits minimum? What us marginal cost and average total cost at thisquantity? c. Give the equation each firm’s supply curve. d. Give the equation for the market supply curve for the shortrun in which the number of firms is fixed. e. What is the equilibrium price and quantity for this market inthe short run? f. In this equilibrium, how much does each firm produce?Calculate each firm’s profit or loss. Is there incentive for…
- the table below shows the output cost and revenue situation of a firm. Study the table and asnwer the questions that fllows Q TVC TC MC P TR MR 0 0 150 0 200 0 - 1 110 C 110 175 175 175 2 170 320 G 150 I L 3 A D 46 135 405 105 4 250 E 34 120 J M 5 B 445 H 105 525 45 360 F 65 90 K N (a) what is the fixed cost of the firm? Explain your answer (b) determine the values from A-M by showing all workings employed (c) At what quantity and price is the firm in equilibrium position and in what market is the firm oeperating? explain your answerThe market for fertilizer is perfectly competitive.Firms in the market are producing output but arecurrently incurring economic losses.a. How does the price of fertilizer compare to theaverage total cost, the average variable cost, andthe marginal cost of producing fertilizer?b. Draw two graphs, side by side, illustrating thepresent situation for the typical firm and for themarket.c. Assuming there is no change in either demand orthe firms’ cost curves, explain what will happenin the long run to the price of fertilizer, marginalcost, average total cost, the quantity supplied byeach firm, and the total quantity supplied to themarket.A local microbrewery has total costs of production given by the equation TC=500+10q+5q2. This implies that the firm's marginal cost is given by the equation MC=10+10q (you do not need to be able to show this). The market demand for beer is given by the equation QD=105 – (1/2)*P. a) Write the equations showing the brewery's average variable cost.
- A local microbrewery has total costs of production given by the equation TC=500+10q+5q2. This implies that the firm's marginal cost is given by the equation MC=10+10q (you do not need to be able to show this). The market demand for beer is given by the equation QD=105 – (1/2)*P. a) Write the equations showing the brewery's average total cost .A toy manufacturer makes miniature trucks. The pricep(in dollar) and the demandx(numberof miniature trucks) are related by the equation 6000−600p=x. The total cost for the sametoy manufacturer to producexminiature trucks can be modeled byC(x) = 8x+ 450.(a) (10 points) Express the pricepin terms of the demandx. Find the revenueR(x) if themanufacturer sellsxminiature trucks in a month and find the domain of this function.(b) (10 points) Graph the cost and revenue functions on the same coordinate system for 0≤x≤6000.(c) (10 points) What is the minimum number of trucks the toy manufacturer must sell tobreak even?(d) (10 points) FindP′(300) and interpret the result.(e) (10 points) What is the exact profit from the sale of the 301stminiature truck?Henry Potter owns the only well in town that produces clean drinking water. He faces the following demand, marginal revenue, and marginal cost curves: Demand: P=60−QP=60−Q Marginal Revenue: MR=60−2QMR=60−2Q Marginal Cost: MC=QMC=Q On the following graph, use the blue line (circle symbol) to graph Mr. Potter's demand curve. Then, use the black line (cross symbol) to graph his marginal revenue (MR) curve. Next, use the orange line (square symbol) to graph his marginal cost (MC) curve. Finally, use the grey point (star symbol) to indicate the profit-maximizing price and quantity. : The profit-maximizing quantity is___units, and the profit-maximizing price is___. Mayor George Bailey, concerned about water consumers, is considering a price ceiling that is 10% below the monopoly price. At this new price, the quantity demanded would be___units. At this quantity, the marginal cost would be___the price. Therefore, the profit-maximizing Mr. Potter___produce…