ASSETS MARRIOTT INTERNATIONAL, INC. CONSOLIDATED BALANCE SHEETS Fiscal Years-Ended 2023 and 2022 (in millions) December 31, 2023 December 31, 2022 Current assets Cash and equivalents Accounts and notes receivable, net Prepaid expenses and other Property and equipment, net Intangible assets Brands Contract acquisition costs and other Goodwill Equity method investments Notes receivable, net Deferred tax assets 338 $ 507 2,712 2,571 261 235 3,311 3,313 1,581 1,585 5,907 5,812 3,283 2,935 8,886 8,872 18,076 17,619 308 335 138 152 673 240 Operating lease assets 929 987 Other noncurrent assets 658 584 $ 25,674 S 24,815 LIABILITIES AND STOCKHOLDERS' (DEFICIT) EQUITY Current liabilities Current portion of long-term debt Accounts payable Accrued payroll and benefits Liability for guest loyalty program Accrued expenses and other Long-term debt Liability for guest loyalty program Deferred tax liabilities Deferred revenue Operating lease liabilities Other noncurrent liabilities Stockholders' (deficit) equity Class A Common Stock Additional paid-in-capital Retained earnings Treasury stock, at cost Accumulated other comprehensive loss See Notes to Consolidated Financial Statements. 553 $ 684 738 746 1,390 1,299 3,328 3,314 1,753 1,296 7,762 7,339 11,320 9,380 3,678 3,280 209 313 1,018 1,059 887 1,034 1,482 1,842 5 5 6,051 5,965 14,838 (20,929) 12,342 (17,015) (647) (729) (682) 568 25,674 $ 24,815 MARRIOTT INTERNATIONAL, INC. CONSOLIDATED STATEMENTS OF INCOME Fiscal Years 2023, 2022, and 2021 (in millions, except per share amounts) 2023 2022 2021 REVENUES Base management fees Franchise fees Incentive management fees Gross fee revenues Contract investment amortization Net fee revenues Owned, leased, and other revenue Cost reimbursement revenue (¹) 1,238 $ 1,044 $ 669 2,831 2,505 1,790 755 529 235 4,824 4,078 2,694 (88) (89) (75) 4,736 3,989 2,619 1,564 1,367 796 17,413 15,417 10,442 23,713 20,773 13,857 OPERATING COSTS AND EXPENSES Owned, leased, and other - direct 1,165 1,074 734 Depreciation, amortization, and other 189 193 220 General, administrative, and other 1,011 891 823 Merger-related charges and other Reimbursed expenses (1) 60 12 8 17,424 15,141 10,322 19,849 17,311 12,107 OPERATING INCOME Gains and other income, net Loss on extinguishment of debt Interest expense Interest income 3,864 3,462 1,750 40 11 10 - (164) (565) (403) (420) 30 26 28 Equity in earnings (losses) (1) 9 18 (24) INCOME BEFORE INCOME TAXES 3,378 3,114 1,180 Provision for income taxes (295) (756) (81) NET INCOME $ 3,083 $ 2,358 $ 1,099 EARNINGS PER SHARE Earnings per share-basic 10.23 $ 7.27 $ 3.36 Earnings per share - diluted 10.18 $ 7.24 $ 3.34 (1) See Note 15 for disclosure of related party amounts.
ASSETS MARRIOTT INTERNATIONAL, INC. CONSOLIDATED BALANCE SHEETS Fiscal Years-Ended 2023 and 2022 (in millions) December 31, 2023 December 31, 2022 Current assets Cash and equivalents Accounts and notes receivable, net Prepaid expenses and other Property and equipment, net Intangible assets Brands Contract acquisition costs and other Goodwill Equity method investments Notes receivable, net Deferred tax assets 338 $ 507 2,712 2,571 261 235 3,311 3,313 1,581 1,585 5,907 5,812 3,283 2,935 8,886 8,872 18,076 17,619 308 335 138 152 673 240 Operating lease assets 929 987 Other noncurrent assets 658 584 $ 25,674 S 24,815 LIABILITIES AND STOCKHOLDERS' (DEFICIT) EQUITY Current liabilities Current portion of long-term debt Accounts payable Accrued payroll and benefits Liability for guest loyalty program Accrued expenses and other Long-term debt Liability for guest loyalty program Deferred tax liabilities Deferred revenue Operating lease liabilities Other noncurrent liabilities Stockholders' (deficit) equity Class A Common Stock Additional paid-in-capital Retained earnings Treasury stock, at cost Accumulated other comprehensive loss See Notes to Consolidated Financial Statements. 553 $ 684 738 746 1,390 1,299 3,328 3,314 1,753 1,296 7,762 7,339 11,320 9,380 3,678 3,280 209 313 1,018 1,059 887 1,034 1,482 1,842 5 5 6,051 5,965 14,838 (20,929) 12,342 (17,015) (647) (729) (682) 568 25,674 $ 24,815 MARRIOTT INTERNATIONAL, INC. CONSOLIDATED STATEMENTS OF INCOME Fiscal Years 2023, 2022, and 2021 (in millions, except per share amounts) 2023 2022 2021 REVENUES Base management fees Franchise fees Incentive management fees Gross fee revenues Contract investment amortization Net fee revenues Owned, leased, and other revenue Cost reimbursement revenue (¹) 1,238 $ 1,044 $ 669 2,831 2,505 1,790 755 529 235 4,824 4,078 2,694 (88) (89) (75) 4,736 3,989 2,619 1,564 1,367 796 17,413 15,417 10,442 23,713 20,773 13,857 OPERATING COSTS AND EXPENSES Owned, leased, and other - direct 1,165 1,074 734 Depreciation, amortization, and other 189 193 220 General, administrative, and other 1,011 891 823 Merger-related charges and other Reimbursed expenses (1) 60 12 8 17,424 15,141 10,322 19,849 17,311 12,107 OPERATING INCOME Gains and other income, net Loss on extinguishment of debt Interest expense Interest income 3,864 3,462 1,750 40 11 10 - (164) (565) (403) (420) 30 26 28 Equity in earnings (losses) (1) 9 18 (24) INCOME BEFORE INCOME TAXES 3,378 3,114 1,180 Provision for income taxes (295) (756) (81) NET INCOME $ 3,083 $ 2,358 $ 1,099 EARNINGS PER SHARE Earnings per share-basic 10.23 $ 7.27 $ 3.36 Earnings per share - diluted 10.18 $ 7.24 $ 3.34 (1) See Note 15 for disclosure of related party amounts.

Cornerstones of Financial Accounting
4th Edition
ISBN:9781337690881
Author:Jay Rich, Jeff Jones
Publisher:Jay Rich, Jeff Jones
Chapter9: Long-term Liabilities
Section: Chapter Questions
Problem 103.4C

Related questions
Question
Financial Statements Analysis:
a) Conduct a horizontal and vertical analysis of the company’s financial statements
to identify trends and patterns over the past two years.
b) Provide an analysis of the company’s financial performance, for shareholders
and potential investors, using the trends identified in (a) above and in the context
of market and other trends and expectations mentioned in the MDA section of the
Annual Report.
c) Briefly explain how the analysis at (b) would be modified if it was prepared for
stakeholders other than shareholders and investors.
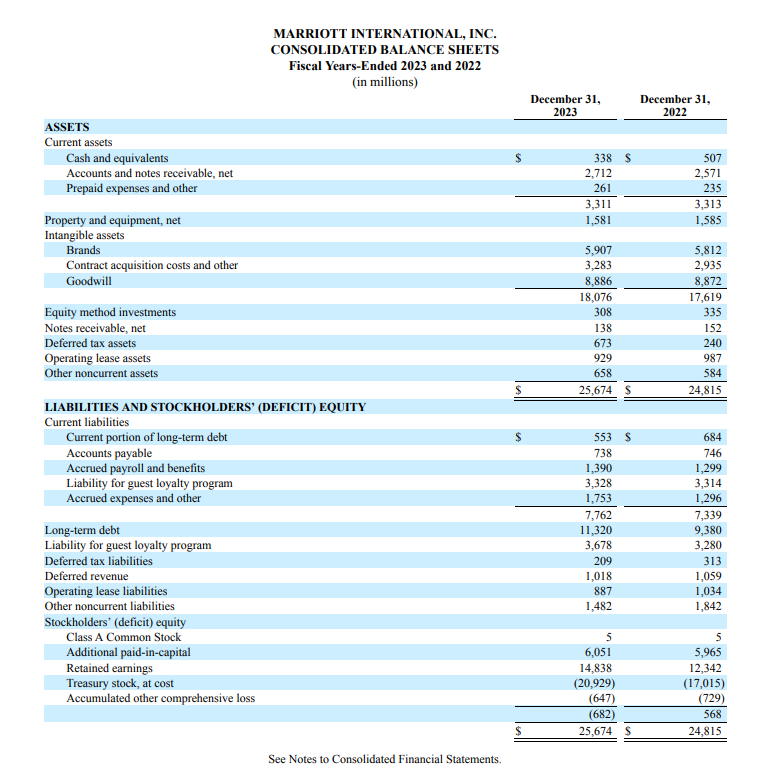
Transcribed Image Text:ASSETS
MARRIOTT INTERNATIONAL, INC.
CONSOLIDATED BALANCE SHEETS
Fiscal Years-Ended 2023 and 2022
(in millions)
December 31,
2023
December 31,
2022
Current assets
Cash and equivalents
Accounts and notes receivable, net
Prepaid expenses and other
Property and equipment, net
Intangible assets
Brands
Contract acquisition costs and other
Goodwill
Equity method investments
Notes receivable, net
Deferred tax assets
338 $
507
2,712
2,571
261
235
3,311
3,313
1,581
1,585
5,907
5,812
3,283
2,935
8,886
8,872
18,076
17,619
308
335
138
152
673
240
Operating lease assets
929
987
Other noncurrent assets
658
584
$
25,674 S
24,815
LIABILITIES AND STOCKHOLDERS' (DEFICIT) EQUITY
Current liabilities
Current portion of long-term debt
Accounts payable
Accrued payroll and benefits
Liability for guest loyalty program
Accrued expenses and other
Long-term debt
Liability for guest loyalty program
Deferred tax liabilities
Deferred revenue
Operating lease liabilities
Other noncurrent liabilities
Stockholders' (deficit) equity
Class A Common Stock
Additional paid-in-capital
Retained earnings
Treasury stock, at cost
Accumulated other comprehensive loss
See Notes to Consolidated Financial Statements.
553 $
684
738
746
1,390
1,299
3,328
3,314
1,753
1,296
7,762
7,339
11,320
9,380
3,678
3,280
209
313
1,018
1,059
887
1,034
1,482
1,842
5
5
6,051
5,965
14,838
(20,929)
12,342
(17,015)
(647)
(729)
(682)
568
25,674 $
24,815
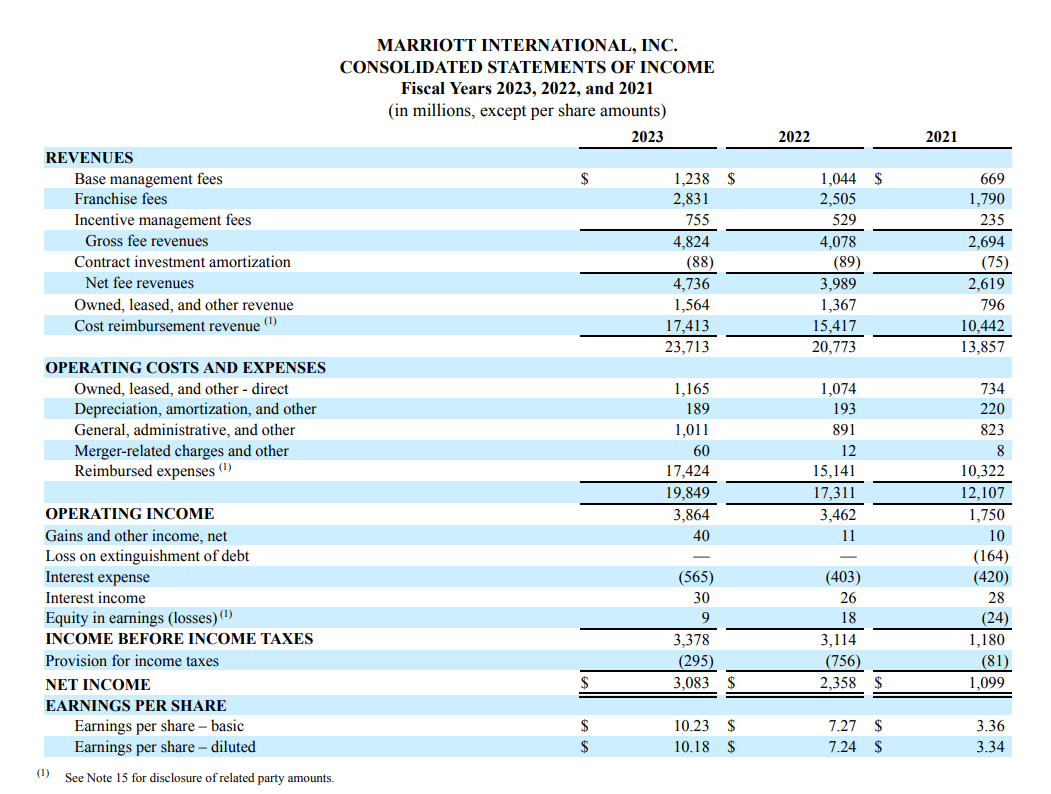
Transcribed Image Text:MARRIOTT INTERNATIONAL, INC.
CONSOLIDATED STATEMENTS OF INCOME
Fiscal Years 2023, 2022, and 2021
(in millions, except per share amounts)
2023
2022
2021
REVENUES
Base management fees
Franchise fees
Incentive management fees
Gross fee revenues
Contract investment amortization
Net fee revenues
Owned, leased, and other revenue
Cost reimbursement revenue (¹)
1,238 $
1,044 $
669
2,831
2,505
1,790
755
529
235
4,824
4,078
2,694
(88)
(89)
(75)
4,736
3,989
2,619
1,564
1,367
796
17,413
15,417
10,442
23,713
20,773
13,857
OPERATING COSTS AND EXPENSES
Owned, leased, and other - direct
1,165
1,074
734
Depreciation, amortization, and other
189
193
220
General, administrative, and other
1,011
891
823
Merger-related charges and other
Reimbursed expenses (1)
60
12
8
17,424
15,141
10,322
19,849
17,311
12,107
OPERATING INCOME
Gains and other income, net
Loss on extinguishment of debt
Interest expense
Interest income
3,864
3,462
1,750
40
11
10
-
(164)
(565)
(403)
(420)
30
26
28
Equity in earnings (losses) (1)
9
18
(24)
INCOME BEFORE INCOME TAXES
3,378
3,114
1,180
Provision for income taxes
(295)
(756)
(81)
NET INCOME
$
3,083 $
2,358 $
1,099
EARNINGS PER SHARE
Earnings per share-basic
10.23 $
7.27 $
3.36
Earnings per share - diluted
10.18 $
7.24 $
3.34
(1) See Note 15 for disclosure of related party amounts.
Expert Solution
This question has been solved!
Explore an expertly crafted, step-by-step solution for a thorough understanding of key concepts.

This is a popular solution!

Trending now
This is a popular solution!

Step by step
Solved in 2 steps

Recommended textbooks for you
Cornerstones of Financial Accounting
Accounting
ISBN:
9781337690881
Author:
Jay Rich, Jeff Jones
Publisher:
Cengage Learning

Intermediate Accounting: Reporting And Analysis
Accounting
ISBN:
9781337788281
Author:
James M. Wahlen, Jefferson P. Jones, Donald Pagach
Publisher:
Cengage Learning

Fundamentals Of Financial Management, Concise Edi…
Finance
ISBN:
9781337902571
Author:
Eugene F. Brigham, Joel F. Houston
Publisher:
Cengage Learning
Cornerstones of Financial Accounting
Accounting
ISBN:
9781337690881
Author:
Jay Rich, Jeff Jones
Publisher:
Cengage Learning
Intermediate Accounting: Reporting And Analysis
Accounting
ISBN:
9781337788281
Author:
James M. Wahlen, Jefferson P. Jones, Donald Pagach
Publisher:
Cengage Learning
Fundamentals Of Financial Management, Concise Edi…
Finance
ISBN:
9781337902571
Author:
Eugene F. Brigham, Joel F. Houston
Publisher:
Cengage Learning

Financial Reporting, Financial Statement Analysis…
Finance
ISBN:
9781285190907
Author:
James M. Wahlen, Stephen P. Baginski, Mark Bradshaw
Publisher:
Cengage Learning
