
MATLAB: An Introduction with Applications
6th Edition
ISBN: 9781119256830
Author: Amos Gilat
Publisher: John Wiley & Sons Inc
expand_more
expand_more
format_list_bulleted
Related questions
Question
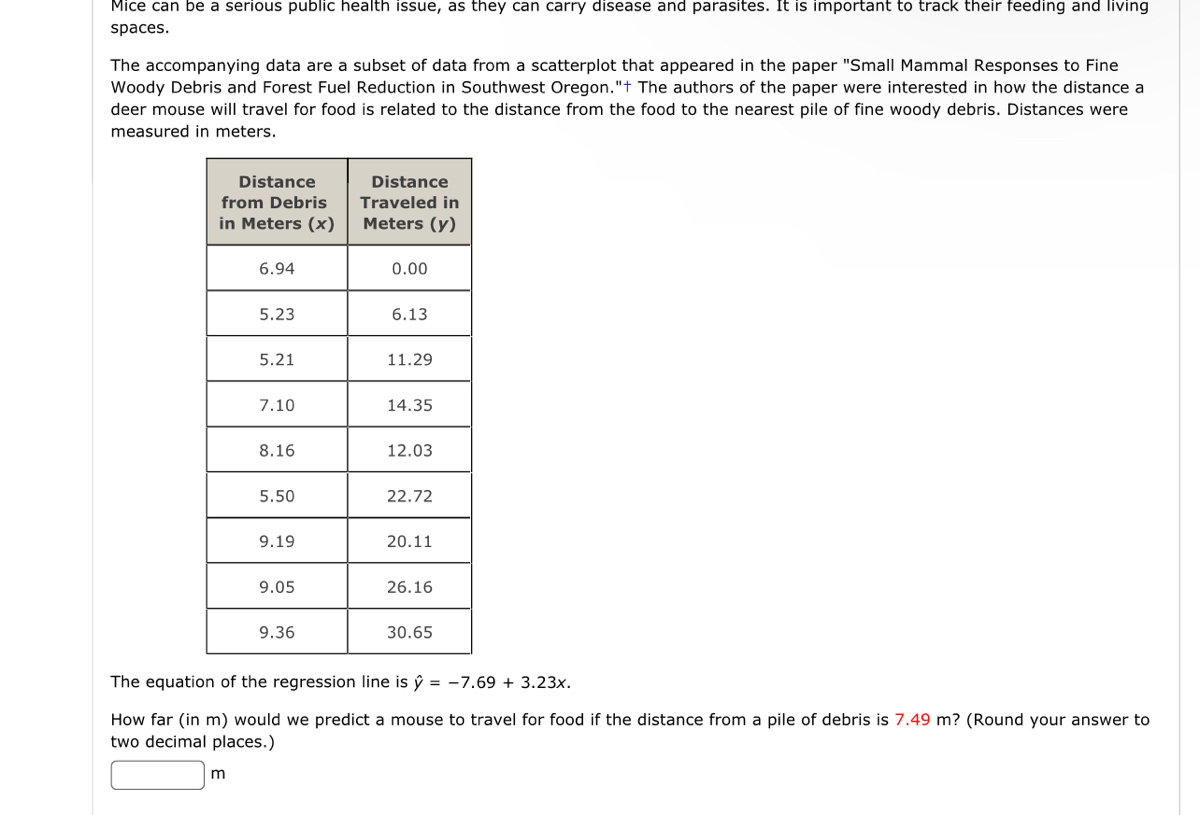

Transcribed Image Text:Mice can be a serious public health issue, as they can carry disease and parasites. It is important to track their feeding and living
spaces.
The accompanying data are a subset of data from a scatterplot that appeared in the paper "Small Mammal Responses to Fine
Woody Debris and Forest Fuel Reduction in Southwest Oregon."+ The authors of the paper were interested in how the distance a
deer mouse will travel for food is related to the distance from the food to the nearest pile of fine woody debris. Distances were
measured in meters.
Distance
from Debris
in Meters (x)
6.94
m
5.23
5.21
7.10
8.16
5.50
9.19
9.05
9.36
Distance
Traveled in
Meters (y)
0.00
6.13
11.29
14.35
12.03
22.72
20.11
26.16
30.65
The equation of the regression line is ŷ = -7.69 + 3.23x.
How far (in m) would we predict a mouse to travel for food if the distance from a pile of debris is 7.49 m? (Round your answer to
two decimal places.)
Expert Solution
This question has been solved!
Explore an expertly crafted, step-by-step solution for a thorough understanding of key concepts.

This is a popular solution

Trending nowThis is a popular solution!

Step by stepSolved in 3 steps with 3 images

Knowledge Booster

Similar questions
- Help me pleasearrow_forwardThe study sorted PIR data into three categories: Use the graphs to estimate the following information from the study. You may wish to record your responses for use in later questions. Part A: The total number of obese men is about million. Part B: The total number of obese women is about million. Part C: The number of obese men with PIR<130% is about million. Part D: The number of obese women with PIR<130% is about million.arrow_forwardA warden is motivated to reduce to aggressive interactions between inmates that sometimes occur in common areas like the yard. He tasks you, the prison psychologist, to find out what can be done to reduce aggressive behavior. Having known the prisoners, you hypothesize that there must be a relation between aggressiveness and having something to keep oneself busy. You get 10 volunteer inmates and give them a scale of aggression and then ask how many hours a week on average they spend with a hobby.The data in z-scoresare: C. Your spouse is a teacher at a highschool. You convince them to run the same scales on some of their students and the r value is .42. At ?=.01is that significantly different than for the one for the inmates?arrow_forward
- Your state is going to vote on becoming a "right to work" state in the next, and you wonder if there is there a relationship between salary levels and unionization. You find data on salary from the U.S. Census, which is split into three groups: Low; Moderate/About Average, and; High. To see if salary, measured in this way, is associated with unionization you find a variable in the same dataset called "UNION", which has two categories: the respondent has a unionized job and the respondent does not have a unionized job. Because you want to know if you should favor or oppose becoming a "right to work" state, you test these two variables to see if there is an association between salary level and unionized labor. What type of hypothesis test is most appropriate?arrow_forwardAnswer only the requirement 2 and 3.arrow_forwardif a study determines the difference in average salary for subpopulations of people with blue eyes and people with brown eyes is not significant then the populations are blue-eyed people and brown-eyed people are what different salariesarrow_forward
arrow_back_ios
arrow_forward_ios
Recommended textbooks for you
- MATLAB: An Introduction with ApplicationsStatisticsISBN:9781119256830Author:Amos GilatPublisher:John Wiley & Sons Inc
 Probability and Statistics for Engineering and th...StatisticsISBN:9781305251809Author:Jay L. DevorePublisher:Cengage Learning
 Statistics for The Behavioral Sciences (MindTap C...StatisticsISBN:9781305504912Author:Frederick J Gravetter, Larry B. WallnauPublisher:Cengage Learning
  Elementary Statistics: Picturing the World (7th E...StatisticsISBN:9780134683416Author:Ron Larson, Betsy FarberPublisher:PEARSON
 The Basic Practice of StatisticsStatisticsISBN:9781319042578Author:David S. Moore, William I. Notz, Michael A. FlignerPublisher:W. H. Freeman
 Introduction to the Practice of StatisticsStatisticsISBN:9781319013387Author:David S. Moore, George P. McCabe, Bruce A. CraigPublisher:W. H. Freeman
MATLAB: An Introduction with Applications
Statistics
ISBN:9781119256830
Author:Amos Gilat
Publisher:John Wiley & Sons Inc
Probability and Statistics for Engineering and th...
Statistics
ISBN:9781305251809
Author:Jay L. Devore
Publisher:Cengage Learning
Statistics for The Behavioral Sciences (MindTap C...
Statistics
ISBN:9781305504912
Author:Frederick J Gravetter, Larry B. Wallnau
Publisher:Cengage Learning
Elementary Statistics: Picturing the World (7th E...
Statistics
ISBN:9780134683416
Author:Ron Larson, Betsy Farber
Publisher:PEARSON
The Basic Practice of Statistics
Statistics
ISBN:9781319042578
Author:David S. Moore, William I. Notz, Michael A. Fligner
Publisher:W. H. Freeman
Introduction to the Practice of Statistics
Statistics
ISBN:9781319013387
Author:David S. Moore, George P. McCabe, Bruce A. Craig
Publisher:W. H. Freeman