Miles per gallon versus speed (miles per hour) for a new model automobile is fitted with a least squares regression line. Following is computer output of the statistical analysis of the data. Dependent variable: Miles per gallon Source df Sum of Squares Mean Square F-ratio Regression 1 199.34 199.34 3.79 Residual 315.54 5.59 Variable Coefficient SE Coef t-ratio P Constant 38.929 5.651 6.89 0.000 Speed -0.2179 0.112 -1.95 0.099 R-Sq = 38.7% S = 7.252 with 8 R-Sq(adj) = 28.5% 2 = 6 degrees of freedom
Miles per gallon versus speed (miles per hour) for a new model automobile is fitted with a least squares regression line. Following is computer output of the statistical analysis of the data. Dependent variable: Miles per gallon Source df Sum of Squares Mean Square F-ratio Regression 1 199.34 199.34 3.79 Residual 315.54 5.59 Variable Coefficient SE Coef t-ratio P Constant 38.929 5.651 6.89 0.000 Speed -0.2179 0.112 -1.95 0.099 R-Sq = 38.7% S = 7.252 with 8 R-Sq(adj) = 28.5% 2 = 6 degrees of freedom

Glencoe Algebra 1, Student Edition, 9780079039897, 0079039898, 2018
18th Edition
ISBN:9780079039897
Author:Carter
Publisher:Carter
Chapter10: Statistics
Section10.3: Measures Of Spread
Problem 1GP

Related questions
Question
7
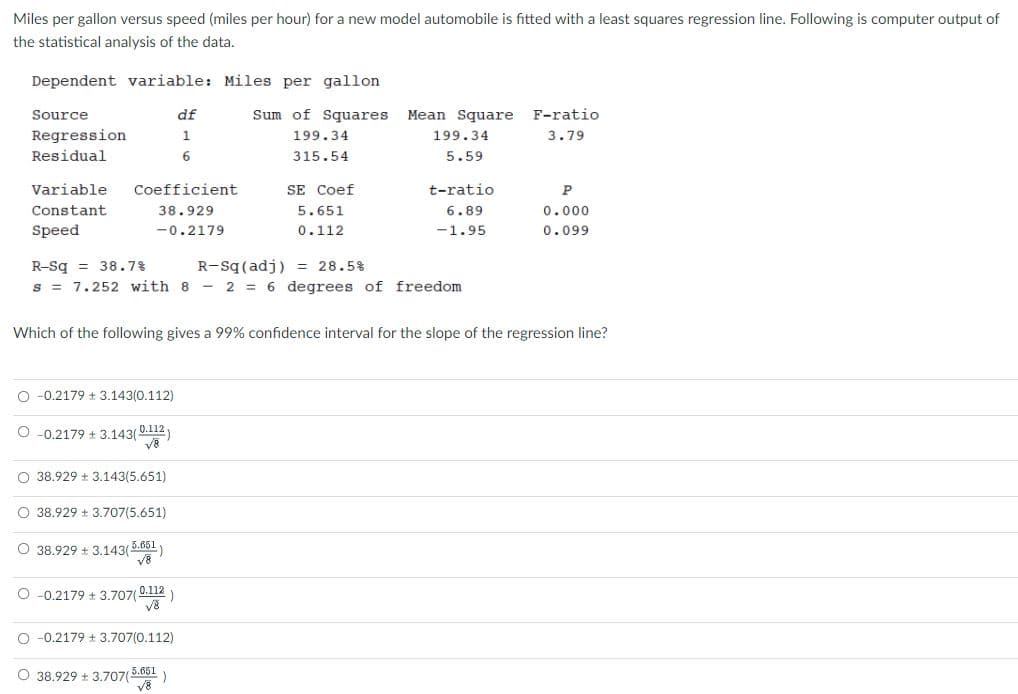
Transcribed Image Text:Miles per gallon versus speed (miles per hour) for a new model automobile is fitted with a least squares regression line. Following is computer output of
the statistical analysis of the data.
Dependent variable: Miles per gallon
Source
df
Sum of Squares
Mean Square
F-ratio
Regression
Residual
1
199.34
199.34
3.79
315.54
5.59
Variable
Coefficient
SE Coef
t-ratio
P
Constant
38.929
5.651
6.89
0.000
Speed
-0.2179
0.112
-1.95
0.099
R-Sq = 38.7%
s = 7.252 with 8 - 2 = 6 degrees of freedom
R-Sq(adj) = 28.5%
Which of the following gives a 99% confidence interval for the slope of the regression line?
O -0.2179 + 3.143(0.112)
O -0.2179 + 3.143(0.112)
O 38.929 + 3.143(5.651)
O 38.929 + 3.707(5.651)
O 38.929 + 3.143(5.651)
v8
O -0.2179 + 3.707(0.112
O -0.2179 + 3.707(0.112)
O 38.929 + 3.707(5.651)
V8
Expert Solution
This question has been solved!
Explore an expertly crafted, step-by-step solution for a thorough understanding of key concepts.

This is a popular solution!

Trending now
This is a popular solution!

Step by step
Solved in 2 steps

Recommended textbooks for you
Glencoe Algebra 1, Student Edition, 9780079039897…
Algebra
ISBN:
9780079039897
Author:
Carter
Publisher:
McGraw Hill

Elementary Linear Algebra (MindTap Course List)
Algebra
ISBN:
9781305658004
Author:
Ron Larson
Publisher:
Cengage Learning
Glencoe Algebra 1, Student Edition, 9780079039897…
Algebra
ISBN:
9780079039897
Author:
Carter
Publisher:
McGraw Hill
Elementary Linear Algebra (MindTap Course List)
Algebra
ISBN:
9781305658004
Author:
Ron Larson
Publisher:
Cengage Learning