Mortgage rates: Following are interest rates (annual percentage rates) for a 30-year fixed rate mortgage from a sample of lenders in Macon, Georgia for one day. It is reasonable to assume that the population is approximately normal. 4.751 4.372 4.175 4.678 4.421 4.229 4.122 4.254 3.952 4.196 Send data to Excel Part: 0 / 2 Part 1 of 2 (a) Construct a 95% confidence interval for the mean rate. Round the answer to at least four decimal places. A 95% confidence interval for the mean rate is 4.1782 << 4.4648 X
Mortgage rates: Following are interest rates (annual percentage rates) for a 30-year fixed rate mortgage from a sample of lenders in Macon, Georgia for one day. It is reasonable to assume that the population is approximately normal. 4.751 4.372 4.175 4.678 4.421 4.229 4.122 4.254 3.952 4.196 Send data to Excel Part: 0 / 2 Part 1 of 2 (a) Construct a 95% confidence interval for the mean rate. Round the answer to at least four decimal places. A 95% confidence interval for the mean rate is 4.1782 << 4.4648 X

Functions and Change: A Modeling Approach to College Algebra (MindTap Course List)
6th Edition
ISBN:9781337111348
Author:Bruce Crauder, Benny Evans, Alan Noell
Publisher:Bruce Crauder, Benny Evans, Alan Noell
Chapter5: A Survey Of Other Common Functions
Section5.3: Modeling Data With Power Functions
Problem 6E: Urban Travel Times Population of cities and driving times are related, as shown in the accompanying...

Related questions
Question
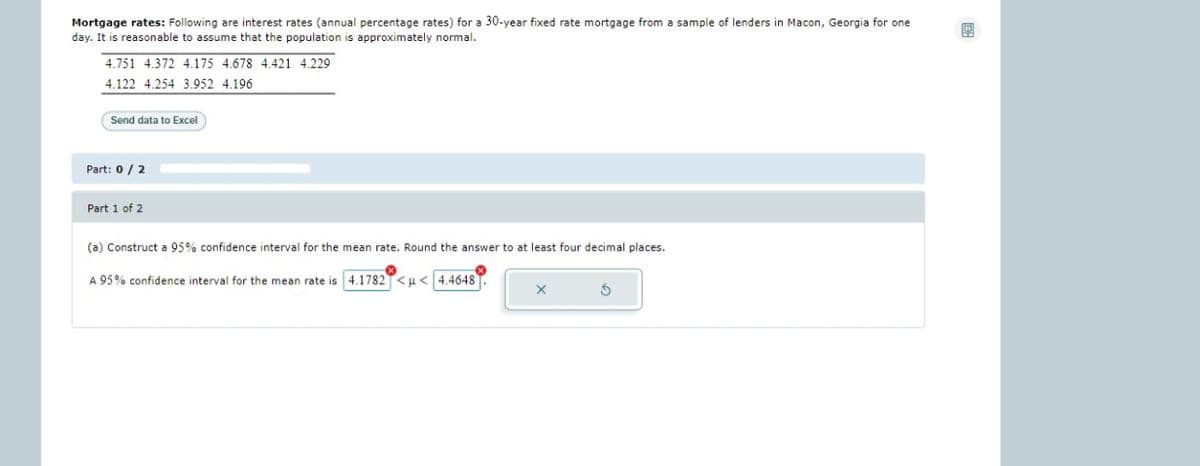
Transcribed Image Text:Mortgage rates: Following are interest rates (annual percentage rates) for a 30-year fixed rate mortgage from a sample of lenders in Macon, Georgia for one
day. It is reasonable to assume that the population is approximately normal.
4.751 4.372 4.175 4.678 4.421 4.229
4.122 4.254 3.952 4.196
Send data to Excel
Part: 0/2
Part 1 of 2
(a) Construct a 95% confidence interval for the mean rate. Round the answer to at least four decimal places.
A 95% confidence interval for the mean rate is 4.1782 << 4.4648
Expert Solution
This question has been solved!
Explore an expertly crafted, step-by-step solution for a thorough understanding of key concepts.

Step by step
Solved in 2 steps with 2 images

Recommended textbooks for you
Functions and Change: A Modeling Approach to Coll…
Algebra
ISBN:
9781337111348
Author:
Bruce Crauder, Benny Evans, Alan Noell
Publisher:
Cengage Learning

Glencoe Algebra 1, Student Edition, 9780079039897…
Algebra
ISBN:
9780079039897
Author:
Carter
Publisher:
McGraw Hill
Functions and Change: A Modeling Approach to Coll…
Algebra
ISBN:
9781337111348
Author:
Bruce Crauder, Benny Evans, Alan Noell
Publisher:
Cengage Learning
Glencoe Algebra 1, Student Edition, 9780079039897…
Algebra
ISBN:
9780079039897
Author:
Carter
Publisher:
McGraw Hill