On the following graph, use the orange points (square symbol) to plot points along the portion of the firm's short-run supply curve that corresponds to prices where there is positive output. (Note: You are given more points to plot than you need.) (?) 100 90 Firm's Short-Run Supply 80 70 60 50 40 30 20 10 0 0 5 40 45 50 10 15 20 25 30 35 QUANTITY (Thousands of jackets) Suppose there are 10 firms in this industry, each of which has the cost curves previously shown. On the following graph, use the orange points (square symbol) to plot points along the portion of the industry's short-run supply curve that corresponds to prices where there is positive output. (Note: You are given more points to plot than you need.) Then, place the black point (plus symbol) on the graph to indicate the short-run equilibrium price and quantity in this market. Note: Dashed drop lines will automatically extend to both axes. (?) 100 90 80 Industry's Short-Run Supply + Equilibrium 70 60 50 40 30 20 10 0 in the short run. In the long run, PRICE (Dollars per jacket) PRICE (Dollars per jacket) Demand 0 50 100 150 200 250 300 350 400 450 500 QUANTITY (Thousands of jackets) At the current short-run market price, firms will
On the following graph, use the orange points (square symbol) to plot points along the portion of the firm's short-run supply curve that corresponds to prices where there is positive output. (Note: You are given more points to plot than you need.) (?) 100 90 Firm's Short-Run Supply 80 70 60 50 40 30 20 10 0 0 5 40 45 50 10 15 20 25 30 35 QUANTITY (Thousands of jackets) Suppose there are 10 firms in this industry, each of which has the cost curves previously shown. On the following graph, use the orange points (square symbol) to plot points along the portion of the industry's short-run supply curve that corresponds to prices where there is positive output. (Note: You are given more points to plot than you need.) Then, place the black point (plus symbol) on the graph to indicate the short-run equilibrium price and quantity in this market. Note: Dashed drop lines will automatically extend to both axes. (?) 100 90 80 Industry's Short-Run Supply + Equilibrium 70 60 50 40 30 20 10 0 in the short run. In the long run, PRICE (Dollars per jacket) PRICE (Dollars per jacket) Demand 0 50 100 150 200 250 300 350 400 450 500 QUANTITY (Thousands of jackets) At the current short-run market price, firms will

Essentials of Economics (MindTap Course List)
8th Edition
ISBN:9781337091992
Author:N. Gregory Mankiw
Publisher:N. Gregory Mankiw
Chapter13: Firms In Competitive Markets
Section: Chapter Questions
Problem 3CQQ

Related questions
Question
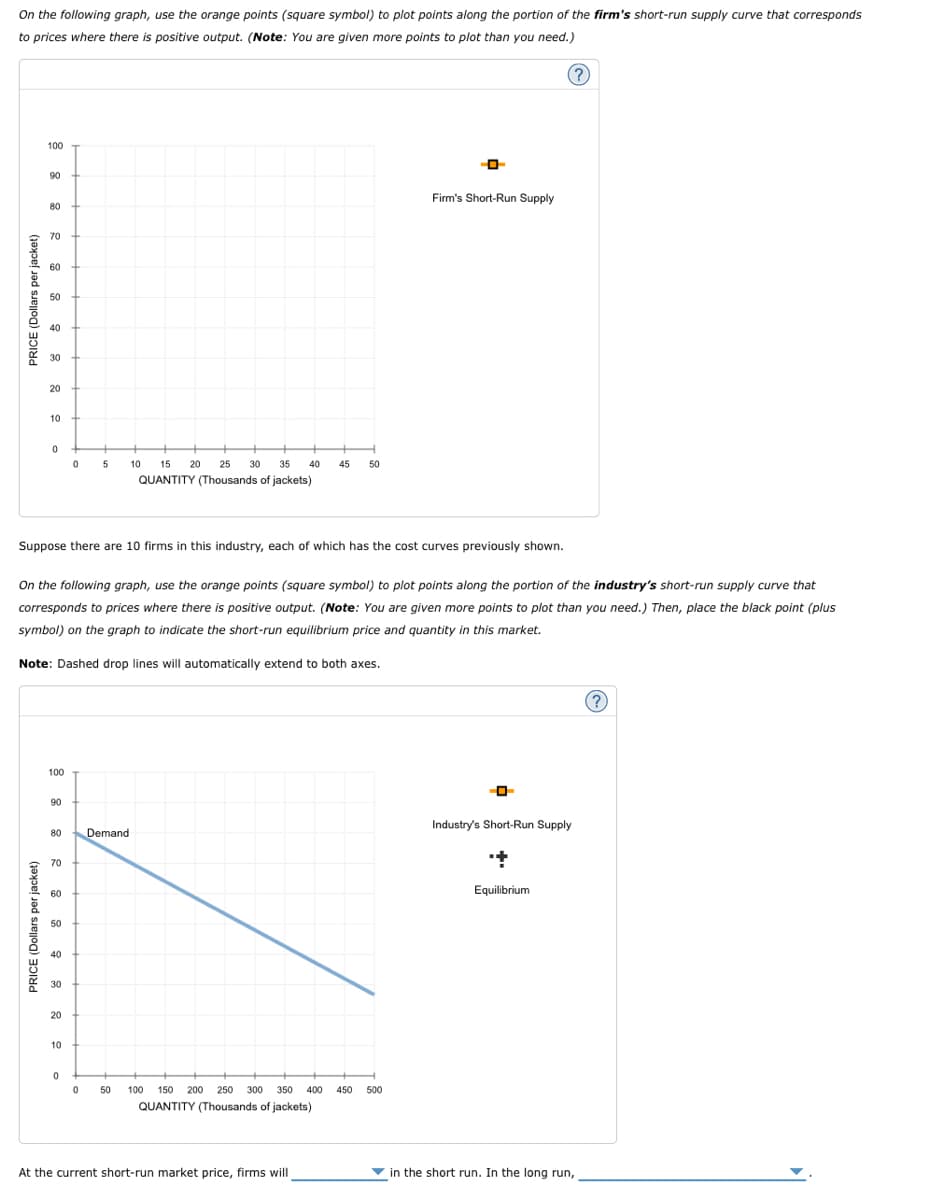
Transcribed Image Text:On the following graph, use the orange points (square symbol) to plot points along the portion of the firm's short-run supply curve that corresponds
to prices where there is positive output. (Note: You are given more points to plot than you need.)
(?)
100
-0-
90
Firm's Short-Run Supply
80
70
60
50
40
30
20
10
0
0
5
10 15 20 25 30 35
40
45 50
QUANTITY (Thousands of jackets)
Suppose there are 10 firms in this industry, each of which has the cost curves previously shown.
On the following graph, use the orange points (square symbol) to plot points along the portion of the industry's short-run supply curve that
corresponds to prices where there is positive output. (Note: You are given more points to plot than you need.) Then, place the black point (plus
symbol) on the graph to indicate the short-run equilibrium price and quantity in this market.
Note: Dashed drop lines will automatically extend to both axes.
(?)
100
90
-0
80 Demand
Industry's Short-Run Supply
++
Equilibrium
70
60
50
40
30
20
10
0
in the short run. In the long run,
PRICE (Dollars per jacket)
PRICE (Dollars per jacket)
100 150 200 250 300 350 400 450 500
QUANTITY (Thousands of jackets)
0
50
At the current short-run market price, firms will
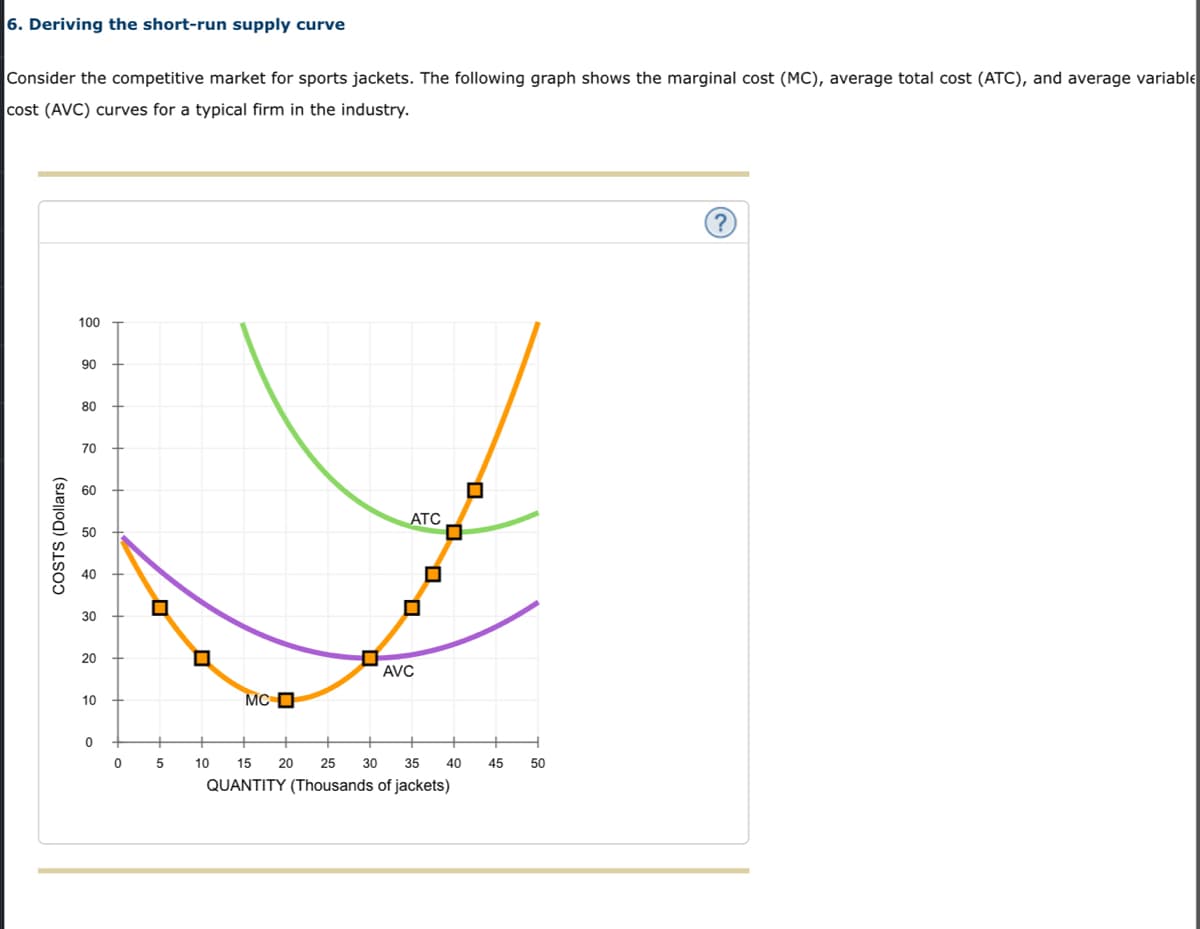
Transcribed Image Text:6. Deriving the short-run supply curve
Consider the competitive market for sports jackets. The following graph shows the marginal cost (MC), average total cost (ATC), and average variable
cost (AVC) curves for a typical firm in the industry.
100
90
80
70
60
ATC
50
40
0
30
20
10
0
COSTS (Dollars)
0
5
▬
☐
AVC
MC
40
10 15 20 25 30 35
QUANTITY (Thousands of jackets)
45
50
Expert Solution
This question has been solved!
Explore an expertly crafted, step-by-step solution for a thorough understanding of key concepts.

This is a popular solution!

Trending now
This is a popular solution!

Step by step
Solved in 2 steps with 2 images

Knowledge Booster


Learn more about
Need a deep-dive on the concept behind this application? Look no further. Learn more about this topic, economics and related others by exploring similar questions and additional content below.Recommended textbooks for you
Essentials of Economics (MindTap Course List)
Economics
ISBN:
9781337091992
Author:
N. Gregory Mankiw
Publisher:
Cengage Learning

Principles of Economics 2e
Economics
ISBN:
9781947172364
Author:
Steven A. Greenlaw; David Shapiro
Publisher:
OpenStax

Principles of Economics, 7th Edition (MindTap Cou…
Economics
ISBN:
9781285165875
Author:
N. Gregory Mankiw
Publisher:
Cengage Learning
Essentials of Economics (MindTap Course List)
Economics
ISBN:
9781337091992
Author:
N. Gregory Mankiw
Publisher:
Cengage Learning
Principles of Economics 2e
Economics
ISBN:
9781947172364
Author:
Steven A. Greenlaw; David Shapiro
Publisher:
OpenStax
Principles of Economics, 7th Edition (MindTap Cou…
Economics
ISBN:
9781285165875
Author:
N. Gregory Mankiw
Publisher:
Cengage Learning

Principles of Economics (MindTap Course List)
Economics
ISBN:
9781305585126
Author:
N. Gregory Mankiw
Publisher:
Cengage Learning

Principles of Microeconomics
Economics
ISBN:
9781305156050
Author:
N. Gregory Mankiw
Publisher:
Cengage Learning

Principles of Microeconomics (MindTap Course List)
Economics
ISBN:
9781305971493
Author:
N. Gregory Mankiw
Publisher:
Cengage Learning