Patients with an average blood pressure of 140 and above are classified as having hypertension. Over the course of 4 visits, the patient's blood pressure is measured as 131 135 143 133 We would like to rule out the possibility that the patient has hypertension, so we put the data into statistical analysis software: N 4 Reading the output, we find that Mean 135.5 • The sample size is n = The sample mean is = • The sample standard deviation is SD = • From this we can calculate the standard error to be SE = SD √n • Calculate the t-score t x - 140 SE • The degrees of freedom for the t-score is n − 1 = Std. Dev. 5.3 Note that the observed sample mean is is less than than 140. This could mean that the patient does not have hypertension, or they could have hypertension, but the small numbers were due to sampling variability. To see if this is the case, we will test the hypothesis that μ = 140 against the alternative that 140 at a significance level of a = 0.05. If we look up the critical value for this problem in the t-table, we find that it is 3.182. • The magnitude of the t-score is (O greater smaller) than the critical value. Therefore we should ( O reject fail to reject) the hypothesis that μ = 140 • Therefore the evidence ( does not does) provide significant reason to believe that the patient is healthy and does not have hypertension.
Patients with an average blood pressure of 140 and above are classified as having hypertension. Over the course of 4 visits, the patient's blood pressure is measured as 131 135 143 133 We would like to rule out the possibility that the patient has hypertension, so we put the data into statistical analysis software: N 4 Reading the output, we find that Mean 135.5 • The sample size is n = The sample mean is = • The sample standard deviation is SD = • From this we can calculate the standard error to be SE = SD √n • Calculate the t-score t x - 140 SE • The degrees of freedom for the t-score is n − 1 = Std. Dev. 5.3 Note that the observed sample mean is is less than than 140. This could mean that the patient does not have hypertension, or they could have hypertension, but the small numbers were due to sampling variability. To see if this is the case, we will test the hypothesis that μ = 140 against the alternative that 140 at a significance level of a = 0.05. If we look up the critical value for this problem in the t-table, we find that it is 3.182. • The magnitude of the t-score is (O greater smaller) than the critical value. Therefore we should ( O reject fail to reject) the hypothesis that μ = 140 • Therefore the evidence ( does not does) provide significant reason to believe that the patient is healthy and does not have hypertension.

Glencoe Algebra 1, Student Edition, 9780079039897, 0079039898, 2018
18th Edition
ISBN:9780079039897
Author:Carter
Publisher:Carter
Chapter10: Statistics
Section10.3: Measures Of Spread
Problem 1GP

Related questions
Question
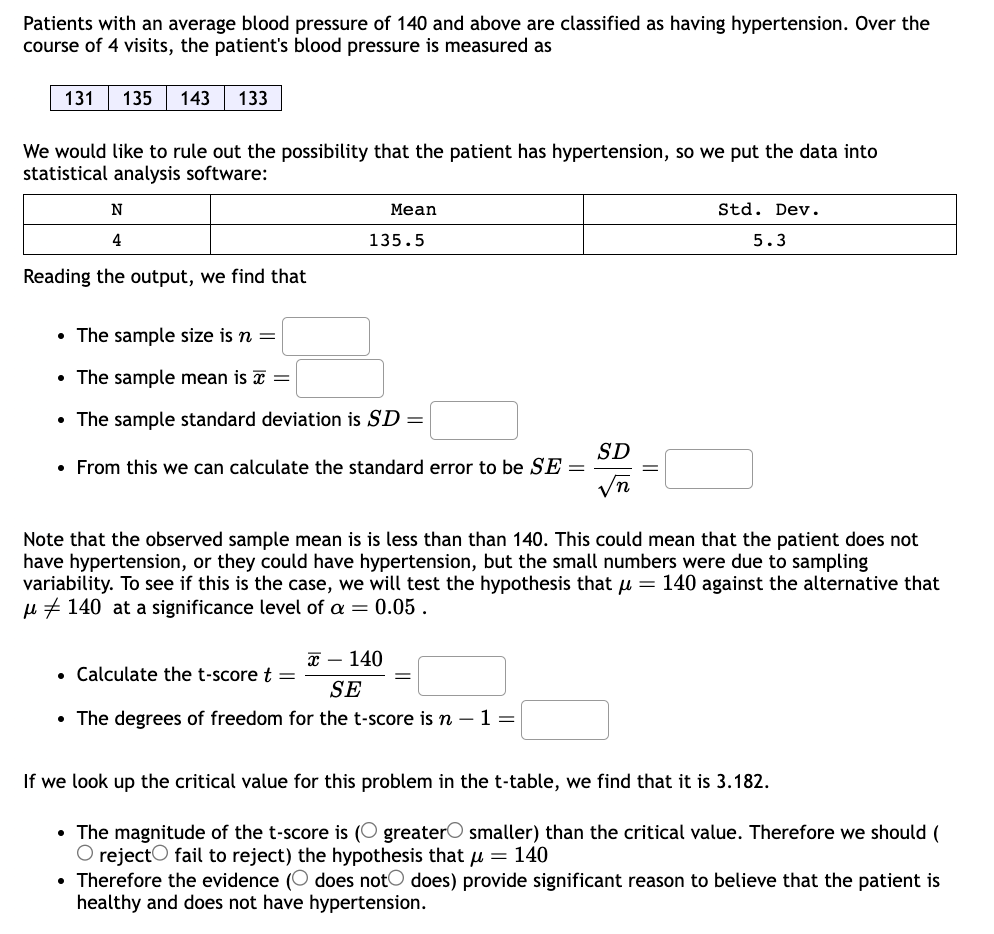
Transcribed Image Text:Patients with an average blood pressure of 140 and above are classified as having hypertension. Over the
course of 4 visits, the patient's blood pressure is measured as
131 135 143 133
We would like to rule out the possibility that the patient has hypertension, so we put the data into
statistical analysis software:
N
4
Reading the output, we find that
Mean
135.5
• The sample size is n =
• The sample mean is =
• The sample standard deviation is SD =
SD
• From this we can calculate the standard error to be SE =
. Calculate the t-score t =
x 140
SE
• The degrees of freedom for the t-score is n - 1 =
Std. Dev.
Note that the observed sample mean is is less than than 140. This could mean that the patient does not
have hypertension, or they could have hypertension, but the small numbers were due to sampling
variability. To see if this is the case, we will test the hypothesis that μ = 140 against the alternative that
μ140 at a significance level of a = 0.05.
5.3
If we look up the critical value for this problem in the t-table, we find that it is 3.182.
• The magnitude of the t-score is (O greater smaller) than the critical value. Therefore we should (
O reject fail to reject) the hypothesis that μ = 140
• Therefore the evidence ( does not does) provide significant reason to believe that the patient is
healthy and does not have hypertension.
Expert Solution
This question has been solved!
Explore an expertly crafted, step-by-step solution for a thorough understanding of key concepts.

Step by step
Solved in 4 steps with 3 images

Recommended textbooks for you
Glencoe Algebra 1, Student Edition, 9780079039897…
Algebra
ISBN:
9780079039897
Author:
Carter
Publisher:
McGraw Hill
Glencoe Algebra 1, Student Edition, 9780079039897…
Algebra
ISBN:
9780079039897
Author:
Carter
Publisher:
McGraw Hill