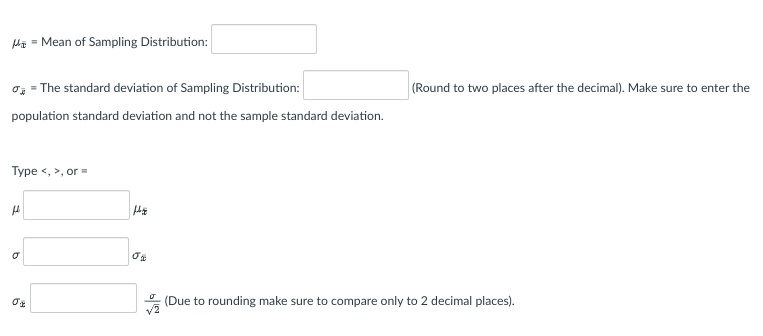
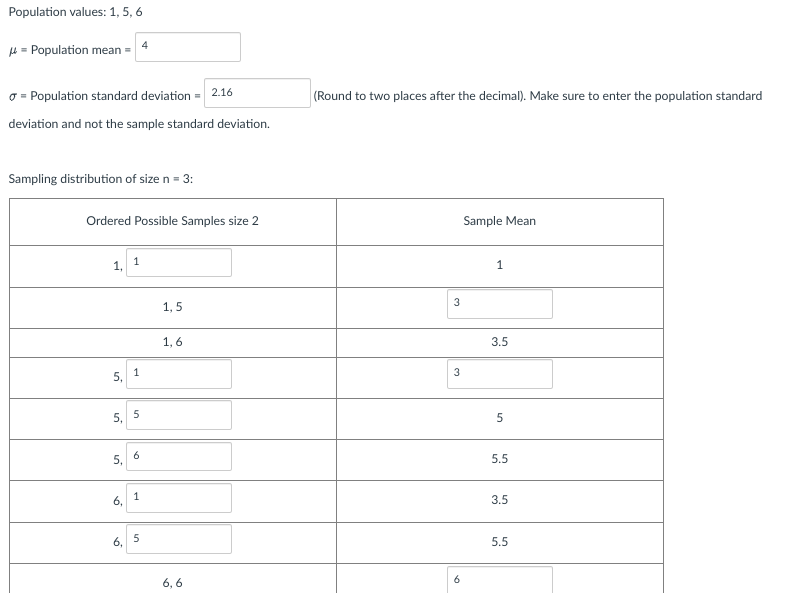
Population values: 1, 5, 6 μ- Population mean - - Population standard deviation - 2.16 deviation and not the sample standard deviation. Sampling distribution of size n = 3: Ordered Possible Samples size 2 1, 5, 1 5, 5 5, 1 6, 6, 6 1 5 1,5 1,6 6,6 (Round to two places after the decimal). Make sure to enter the population standard 3 3 Sample Mean 1 3.5 5 5.5 3.5 5.5


Q: f n=200 and X=80, construct a 99% confidence interval estimate for the population proportion.
A:
Q: If you want to be 95% confident of estimating the population proportion to within a sampling error…
A:
Q: Bargain Rental Car offers rental cars in an off-airport location near a major tourist destination in…
A: Given data: Month Rental Returns, x Car Wash Costs, y January 2300 10300 February 2500 12800…
Q: Random Variable X counts the number of students who passed a test in a class of 50 students. Match…
A: Given information: Random variable X counts the number of students who passed a test in a class of…
Q: Value: Frequency: Calculate the mean and standard deviation from the following data: 80-89 50-59…
A: Given that: Value: 90-99 80-89 70-79 60-69 50-59 40-49 30-39 Frequency 2 12 22 20 14 4 1
Q: If, in a sample of n = 20 selected from a normal population, X= 53 and S = 12, what are the critical…
A: Here, n= 20 and α=0.01. As the direction of H1 is "not equal to", this is a two tailed test.
Q: 40 0 -40 0.4 1980 2 4 6 8 10 1990 12 PACF -0.4 0.0 0.4 2000 1 2 T MA 4 6 8 2010 10 12
A: Based on the ACF plot it can be seen that there are no significant spike outside the threshold.…
Q: The television show 50 Minutes has been successful for many years. That show recently had a share of…
A: Given P=30% n=10
Q: Annual high temperatures in a certain location have been tracked for several years. Let X represent…
A: Karl Pearson suggested a measure of correlation between the two variables. It is known as karl…
Q: The test statistic of z= 1.64 is obtained when testing the claim that p *0.737. a. Identify the…
A: GivenThe test statistic of z=1.64claim is p≠0.737
Q: A consumer products testing group is evaluating two competing brands of tires, Brand 1 and Brand 2.…
A: Given Claim : the consumer group conclude that the mean tread wear of Brand 1 exceeds that of Brand…
Q: Which of the following samples taken from the sample 10, 20, 30, 40, 50 could be a bootstrap sample?…
A: Given sample: 10, 20, 30, 40, 50 Required: To identify the sample that could be a bootstrap sample.
Q: f the manager of a bottled water distributor wants to estimate, with 95% confidence, the mean…
A: Given,margin of error(E)=0.004standard deviation(σ)=0.04α=1-0.95=0.05α2=0.025Z0.025=1.96 (from…
Q: Part 1 of 4 (a) Construct a 98% confidence interval for the mean number of personal computers. Round…
A: It is given that Sample mean = 2.38 Population standard deviation = 0.9 Sample size = 195
Q: Interpret the following values for an odds ratio (OR) and Relative Risk (RR) 1. OR = 1.0; OR = 0.5;…
A: Given: 1). OR=1.0; OR=0.5; OR=2.0 2). RR=1.0; RR=0.5; RR=2.0
Q: A credit card company claims that the mean credit card debt for individuals greater than $5,200. You…
A: N=26 Dof= n-1=26-1=25 Population mean =5200 Sample mean =5398 Level of significance =0.0 We have to…
Q: Be sure that you show all your work to reach your answer. Each step must be on a separate line.…
A: In 2018: 78 out of 456 students In 2019: 67 out of 501 students
Q: If, in a one-tail hypothesis test where H0 is only rejected in the upper tail, the p-value=0.6792…
A: Given information: In a one-tail hypothesis test where H0 is only rejected in the upper tail, the…
Q: 1. Determine the distribution of Y if its MGF is as follows: = cp[{{11+0²1²} exp inl a. my(t) =
A:
Q: Company XYZ know that replacement times for the quartz time pieces it produces are normally…
A: From the given information we find the solution.
Q: -year
A:
Q: Here are some of the Final Exam scores from last semester's class: 81, 77, 90, 93, 99, 88, 85, 70,…
A: Given n=12
Q: Exercise 1.14 (Static) THE BANK CUSTOMER WAITING TIME CASE A bank manager has developed a new system…
A: Given information: 1.6, 6.6, 5.6, 5.1, 3.9, 4.6, 6.5, 6.4, 8.6, 4.2, 5.8, 3.4, 9.3, 7.4, 1.8, 6.2,…
Q: A. State the null hypothesis H0 and the alternative hypothesis H1 B. Find the value of the test…
A: The hypothesis test are used to make comparsion for larger population by taking sample. If the…
Q: A local college recently made the news by offering foreign language-speaking dorms to its students.…
A:
Q: Construct a LINE GRAPH involving the measurement of Systolic blood pressure for PATIENT 2 ONLY.
A: For constructing line chart: 1) Enter your data of patient 2 in excel. 2) Select your data than go…
Q: ED * > of ܀ • As shown above, a classic deck of cards is made up of 52 cards, 26 are black, 26 are…
A: Given data A classic deck of cards is made up of 52 cards 26 are black 26 are red Each color is…
Q: (c) Describe the overall trend in each of Danny's investments over the 8-year period.
A: As per the requirement , solving part(c).
Q: X~ N(10,12). Suppose that you form random samples of 16 from this distribution. Let be the random…
A: As per our guidelines we are supposed to answer only 3 sub-parts of any questions so i am solving…
Q: Business Weekly conducted a survey of graduates from 30 top MBA programs. On the basis of the…
A: The question is about prob. dist. Given : Popl. mean annual salary ( μ ) = 167000 dollars Popl. std.…
Q: What is the range of this data set? range = What is the standard deviation of this data set?
A: It is given that the sample of size n = 10 is 122.9 96.4 101.6 109.4 115.8 91.7 122.9 122.9 81…
Q: In a random sample of 100 items,15 are defective. If the null hypothesis is that 15% of the items…
A: Given info: In a random sample of 100 items,15 are defective. The null hypothesis is that 15% of…
Q: 2.27 Textbook Prices The table shows prices of 50 college textbooks in a community college…
A: The objective is to make an appropriate graph of the distribution of data, pose a statistical…
Q: If, in a sample of n = 30 selected from a normal population, X= 57 and S=20, what is your…
A: Given Population mean = 50 Sample mean =57 Sample standard deviation =20 We have to answer for…
Q: = 142 is the number of M&Ms in my bag and x =38 is my count for Blue M&Ms. What is the probability…
A: It is given that Total number of M&Ms in bags = n = 142 Number of blue M&Ms = x= 35
Q: 15 20 25 30 (c) Find the sample correlation coefficient r and the coefficient of determination.…
A: Disclaimer: Since you have posted a question with multiple sub-parts, we will solve the first three…
Q: Insurance companies are interested in knowing the popul drivers who always buckle up before riding…
A: Given data,No of people surveyed n=387who claims to buckle up is x=311Construct a 93 % CI?
Q: a. Write a few short sentences that compare the center and the spread for each dotplot. b. Based on…
A: The question is about center and spread of a dist. Given :
Q: The distribution of IQ scores of the population is normally distributed with a mean of 100 and a…
A: Given distribution is normally distributed. Let, X: IQ scores of population Mean=μ=100 Standard…
Q: In a random sample of 29 residents living in major cities on the West Coast (Group 1) and 29…
A: The z test is the model of parametric test. Z test follow the assumption of normal distribution. It…
Q: The owner of a chain of mini-markets wants to compare the sales performance of two of her stores,…
A: Claim : the owner conclude that the mean daily sales of the two stores differ
Q: A consumer products testing group is evaluating two competing brands of tires, Brand 1 and Brand 2.…
A: The following information has been given: Brand 1 Brand 2 Difference (d) (Brand 1 -Brand 2)…
Q: Listed below are the numbers of words spoken in a day by each member of six different couples. The…
A: Given data: Males 5638 21319 17572 26429 46978 25835 Females 5198 11661 19624 13397 31553 18667…
Q: Determine the distribution of Y if its MGF is as follows: = ∞ {£m² +0°r} a. my(t) = exp
A: it is the MGF of normal distribution.
Q: A population is normally distributed with a mean of 50 and a standard deviation of 10. Find the…
A: Given data,Mean μ=50sd σ=10P(X<44)=?
Q: You are working as an assistant to the dean of institutional research at your university. The dean…
A: The question is about confidence interval Given : Randomly selected no. of graduates ( n ) = 100…
Q: Consider the following data representing the price of refrigerators (in dollars). 14591459,…
A: For the given data, we have to calculate frequency table. Relative frequency =(frequency / total)
Q: What is meant by the statement, "Correlation does not imply causation"? Provide an example to…
A: We have given that What is meant by the statement, "Correlation does not imply causation" We have to…
Q: Working at home: According to the U.S. Census Bureau, 34% of men who worked at home were college…
A: It is given that n=500 and the sample proportion p-hat is0.34.
Q: If a population has a mean of 24.6 and a standard deviation of 66.4 then a sampling distribution for…
A: Given data mean=24.6 standard deviation=66.4 n=43

Step by step
Solved in 2 steps

- Find the mean and standard deviation of the indicated sampling distribution of sample means. Then sketch a graph of the sampling distributions. The zloty is the official currency of Poland. During a recent period of two years the day ahead prices for a renewable energy in Poland have a mean of 158.51 and a standard deviation of 33.424. Random samples of size 100 are drawn from this population and the mean of each sample is determinedFind the mean adn standard deviation of the indicated sampling distribution of sample means. Then sketch a graph of the sampling distribution. In a recent study involving 42 men the man temperature of the mean was found to be 96.8F with a standard deviation of 0.61. Random sample size 30 are drawn from this population and the mean of each sample is determined.A biologist studies the gestation period of wolves. Past data reveals that such gestation periods have a mean of 65 days with standard deviation 20days. The normal distribution for the population is shown by the dotted black line. The biologist plans to take a random sample of 15such wolves and will calculate the mean gestation period of the sample to compare to the known gestation periods. Compute the mean and standard deviation of the sampling distribution of sample means for a sample of size 15. Round your answers to the nearest tenth. Show your answer by moving the two draggable points to build the sampling distribution.
- The mean weights from a sample of 100 bumblebee bats taken from a certain population is 5, sample standard deviation is 1. Calculate the test statistic to test hypothesis: The population mean is 5.1A population has mean of 120 and standard deviation of 10. A sample of size 5015 is taken from the population. What is the mean and the standard deviation of the sampling distribution of the sample mean?A random sample of 100 school administrators were conducted a Training Course. The sample mean and standard deviation were 90 and 5 respectively. In the standardization of the test, the mean was 85 and the standard deviation of 6. Test the significant difference using α=0.05 utilizing the p-value method.a. The p-value is0.00020.00230.00460.0001b. The Decision isAccept the null hypothesis.There is a significant difference between the sample mean and the population mean.Accept the null hypothesis.There is no significant difference between the sample mean and the population mean.Reject the null hypothesis. There is no significant difference between the sample mean and the population mean.Reject the null hypothesis. There is a significant difference between the sample mean and the population mean.c. The null hypothesis isμ<85μ>85μ=85μ≤85d. The alternative hypothesis isμ≠85μ<85μ>85μ=85e. The value of the test statistic is8.035.338.33none of these
- find a point estimate for the population standard deviation (i.e., the standard deviation of the variable) A simple random sample is taken from a population and yields the following data for a variable of the population: 20 2 6 2 12 6 9 8 16 8 21 Find a point estimate for the population mean (i.e., the mean of the variable).Steel rods manufactured in a plant must be a minimum of 2 metres in length in order to pass through an inspection procedure. Steel rods with lengths that are normally distributed, with a mean of 2.1 metres and a standard deviation of 0.1 metres, are produced during the manufacturing process. A random sample of 25 steel rods is chosen, and their lengths are measured using a tape measure. i. Decide on the appropriate distribution of the sample mean of the 25 steel rods in the sample using the appropriate distribution formula. ii. Calculate the probability that the sample mean of steel rods that meet the minimum length requirement is the same as the mean of the entire sample. iii. For example, if the observed sample mean length of steel rods is 2.15, calculate the 98% two-sided confidence interval for the true mean length of the manufacturing process, assuming that it is not known.Sample of 75 are selected from a population with mean 29 and standard deviation of 7.5. The mean of the sampling distribution of sample means is?
- Blood platelet counts of women have a bell-shaped distribution with a mean of 255.1 and a standard deviation of 65.4 (all units are 1000 cells/µL). Using the empirical-rule, what is the approximate percentage of women with platelet counts (a) Within 2 standard deviation of the mean, or between 124.3 and 385.9 [1] (b) Between 189.7 and 320.5The applicants to a company took a 60-item entrance exam. Their scores resemble a normal distribution with a mean of 50 and a standard deviation of 4. If the company would like to have the top 20% of the applicants go on the next phase of the application process, what should be their cut-off score (nearest hundredths) in the examMillionaires. Professor Thomas Stanley of Georgia State University has surveyed millionaires since 1973. Among other information, Professor Stanley obtains estimates for the mean age, μ, of all U.S. millionaires. Suppose that one year’s study involved a simple random sample of 36 U.S. millionaires whose mean age was 58.53 years with a sample standard deviation of 13.36 years. a. If, for next year’s study, a confidence interval for μ is to have a margin of error of 2 years and a confidence level of 95%, determine the required sample size. b. Why did you use the sample standard deviation, s = 13.36, in place of σ in your solution to part (a)? Why is it permissible to do so?