ppose you conduct a study using an independent-measures research design, and you intend to use the independent-measures t test to test whether e means of the two independent populations are the same. The following is a table of the information you gather. Fill in any missing values. Sample 1 Sample 2 Sample Size Degrees of Freedom n1 = 11 n2 = 21 Sample Mean M₁ = 4.5 M2 = 3.6 Standard Deviation S1 = 5.4 e estimated standard error of the difference in sample means for your study is e degrees of freedom for this t statistic is Sums of Squares e pooled variance for your study is (Note: You are being asked for this value to three decimal places, because you will need to use it in cceeding calculations. For the most accurate results, retain these three decimal places throughout the calculations.) SS2 = 1,248.2 et statistic for your independent-measures t test, when the null hypothesis is that the two population means are the same, is
ppose you conduct a study using an independent-measures research design, and you intend to use the independent-measures t test to test whether e means of the two independent populations are the same. The following is a table of the information you gather. Fill in any missing values. Sample 1 Sample 2 Sample Size Degrees of Freedom n1 = 11 n2 = 21 Sample Mean M₁ = 4.5 M2 = 3.6 Standard Deviation S1 = 5.4 e estimated standard error of the difference in sample means for your study is e degrees of freedom for this t statistic is Sums of Squares e pooled variance for your study is (Note: You are being asked for this value to three decimal places, because you will need to use it in cceeding calculations. For the most accurate results, retain these three decimal places throughout the calculations.) SS2 = 1,248.2 et statistic for your independent-measures t test, when the null hypothesis is that the two population means are the same, is

MATLAB: An Introduction with Applications
6th Edition
ISBN:9781119256830
Author:Amos Gilat
Publisher:Amos Gilat
Chapter1: Starting With Matlab
Section: Chapter Questions
Problem 1P

Related questions
Question
Take your time answer the questions, this is all one question, please answer correctly, thank you very much, will write an wonderful review when solutions are done.
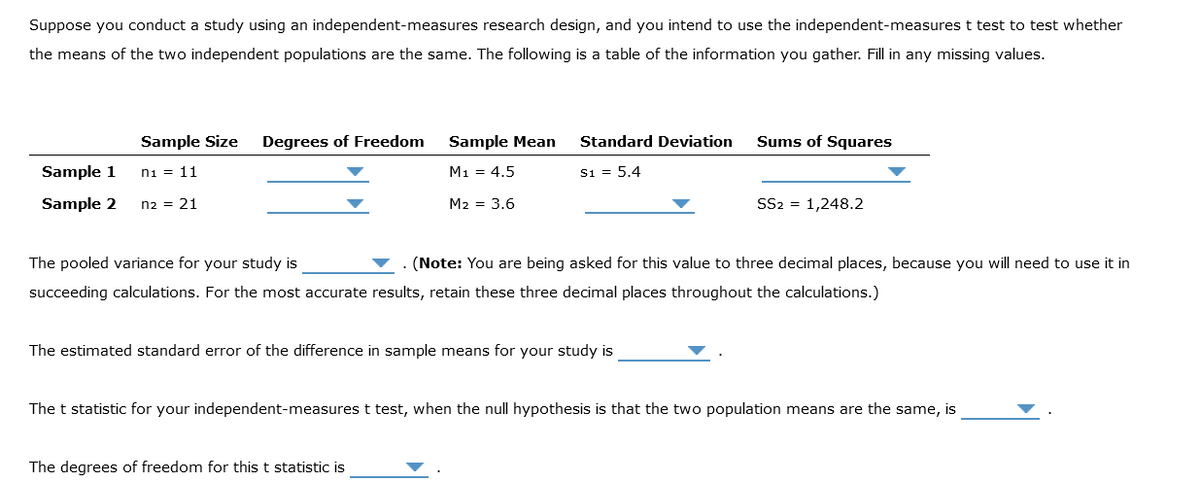
Transcribed Image Text:Suppose you conduct a study using an independent-measures research design, and you intend to use the independent-measures t test to test whether
the means of the two independent populations are the same. The following is a table of the information you gather. Fill in any missing values.
Sample 1
Sample 2
Sample Size Degrees of Freedom
n1 = 11
n2 = 21
Sample Mean
M₁ = 4.5
M2 = 3.6
Standard Deviation
S1 = 5.4
The degrees of freedom for this t statistic is
The estimated standard error of the difference in sample means for your study is
Sums of Squares
The pooled variance for your study is
(Note: You are being asked for this value to three decimal places, because you will need to use it in
succeeding calculations. For the most accurate results, retain these three decimal places throughout the calculations.)
SS2 = 1,248.2
The t statistic for your independent-measures t test, when the null hypothesis is that the two population means are the same, is
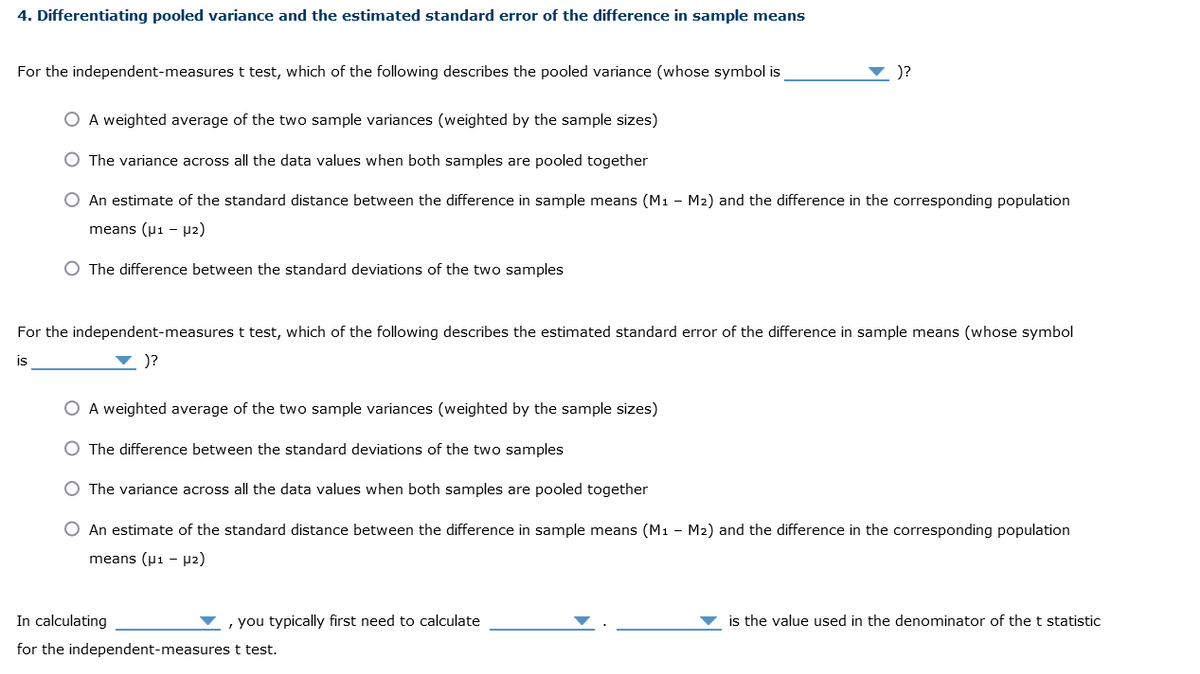
Transcribed Image Text:4. Differentiating pooled variance and the estimated standard error of the difference in sample means
For the independent-measures t test, which of the following describes the pooled variance (whose symbol is
O A weighted average of the two sample variances (weighted by the sample sizes)
The variance across all the data values when both samples are pooled together
O An estimate of the standard distance between the difference in sample means (M₁ - M₂) and the difference in the corresponding population
means (μ1 µ₂)
O The difference between the standard deviations of the two samples
)?
For the independent-measures t test, which of the following describes the estimated standard error of the difference in sample means (whose symbol
)?
is
O A weighted average of the two sample variances (weighted by the sample sizes)
O The difference between the standard deviations of the two samples
O The variance across all the data values when both samples are pooled together
O An estimate of the standard distance between the difference in sample means (M1 - M2) and the difference in the corresponding population
means (μ1 µ₂)
In calculating
for the independent-measures t test.
, you typically first need to calculate
is the value used in the denominator of the t statistic
Expert Solution
This question has been solved!
Explore an expertly crafted, step-by-step solution for a thorough understanding of key concepts.

This is a popular solution!

Trending now
This is a popular solution!

Step by step
Solved in 2 steps with 1 images

Recommended textbooks for you
MATLAB: An Introduction with Applications
Statistics
ISBN:
9781119256830
Author:
Amos Gilat
Publisher:
John Wiley & Sons Inc

Probability and Statistics for Engineering and th…
Statistics
ISBN:
9781305251809
Author:
Jay L. Devore
Publisher:
Cengage Learning

Statistics for The Behavioral Sciences (MindTap C…
Statistics
ISBN:
9781305504912
Author:
Frederick J Gravetter, Larry B. Wallnau
Publisher:
Cengage Learning
MATLAB: An Introduction with Applications
Statistics
ISBN:
9781119256830
Author:
Amos Gilat
Publisher:
John Wiley & Sons Inc
Probability and Statistics for Engineering and th…
Statistics
ISBN:
9781305251809
Author:
Jay L. Devore
Publisher:
Cengage Learning
Statistics for The Behavioral Sciences (MindTap C…
Statistics
ISBN:
9781305504912
Author:
Frederick J Gravetter, Larry B. Wallnau
Publisher:
Cengage Learning

Elementary Statistics: Picturing the World (7th E…
Statistics
ISBN:
9780134683416
Author:
Ron Larson, Betsy Farber
Publisher:
PEARSON

The Basic Practice of Statistics
Statistics
ISBN:
9781319042578
Author:
David S. Moore, William I. Notz, Michael A. Fligner
Publisher:
W. H. Freeman

Introduction to the Practice of Statistics
Statistics
ISBN:
9781319013387
Author:
David S. Moore, George P. McCabe, Bruce A. Craig
Publisher:
W. H. Freeman