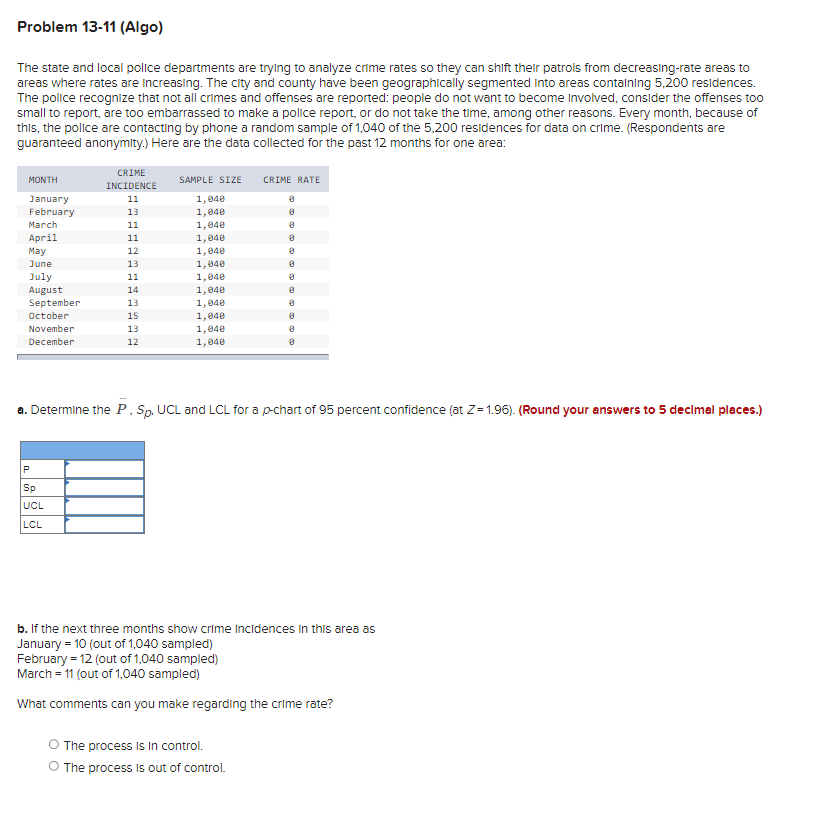
Problem 13-11 (Algo) The state and local police departments are trying to analyze crime rates so they can shift their patrols from decreasing-rate areas to areas where rates are increasing. The city and county have been geographically segmented into areas containing 5,200 residences. The police recognize that not all crimes and offenses are reported: people do not want to become Involved, consider the offenses too small to report, are too embarrassed to make a police report, or do not take the time, among other reasons. Every month, because of this, the police are contacting by phone a random sample of 1,040 of the 5,200 residences for data on crime. (Respondents are guaranteed anonymity.) Here are the data collected for the past 12 months for one area: MONTH January February March April May June July August September October November December CRIME INCIDENCE 11 13 11 11 12 13 11 14 13 15 13 12 P Sp UCL LCL SAMPLE SIZE 1,040 1,040 1,040 1,040 1,040 1,040 1,040 1,040 1,040 1,040 1,040 1,040 CRIME RATE 8 8 8 8 8 8 8 8 8 a. Determine the P, Sp, UCL and LCL for a p-chart of 95 percent confidence (at Z=1.96). (Round your answers to 5 decimal places.)
Problem 13-11 (Algo) The state and local police departments are trying to analyze crime rates so they can shift their patrols from decreasing-rate areas to areas where rates are increasing. The city and county have been geographically segmented into areas containing 5,200 residences. The police recognize that not all crimes and offenses are reported: people do not want to become Involved, consider the offenses too small to report, are too embarrassed to make a police report, or do not take the time, among other reasons. Every month, because of this, the police are contacting by phone a random sample of 1,040 of the 5,200 residences for data on crime. (Respondents are guaranteed anonymity.) Here are the data collected for the past 12 months for one area: MONTH January February March April May June July August September October November December CRIME INCIDENCE 11 13 11 11 12 13 11 14 13 15 13 12 P Sp UCL LCL SAMPLE SIZE 1,040 1,040 1,040 1,040 1,040 1,040 1,040 1,040 1,040 1,040 1,040 1,040 CRIME RATE 8 8 8 8 8 8 8 8 8 a. Determine the P, Sp, UCL and LCL for a p-chart of 95 percent confidence (at Z=1.96). (Round your answers to 5 decimal places.)

Algebra and Trigonometry (MindTap Course List)
4th Edition
ISBN:9781305071742
Author:James Stewart, Lothar Redlin, Saleem Watson
Publisher:James Stewart, Lothar Redlin, Saleem Watson
Chapter10: Systems Of Equations And Inequalities
Section10.FOM: Focus On Modeling: Linear Programming
Problem 14P

Related questions
Question
Transcribed Image Text:Problem 13-11 (Algo)
The state and local police departments are trying to analyze crime rates so they can shift their patrols from decreasing-rate areas to
areas where rates are increasing. The city and county have been geographically segmented into areas containing 5,200 residences.
The police recognize that not all crimes and offenses are reported: people do not want to become Involved, consider the offenses too
small to report, are too embarrassed to make a police report, or do not take the time, among other reasons. Every month, because of
this, the police are contacting by phone a random sample of 1,040 of the 5,200 residences for data on crime. (Respondents are
guaranteed anonymity.) Here are the data collected for the past 12 months for one area:
MONTH
January
February
March
April
May
June
July
August
September
October
November
December
CRIME
INCIDENCE
11
13
11
11
12
13
11
14
13
15
13
12
P
Sp
UCL
LCL
SAMPLE SIZE
1,040
1,040
1,040
1,040
1,040
1,040
1,040
1,040
1,040
1,040
1,040
1,040
CRIME RATE
8
8
O The process is in control.
O The process is out of control.
8
8
8
8
8
a. Determine the P, Sp, UCL and LCL for a p-chart of 95 percent confidence (at Z=1.96). (Round your answers to 5 decimal places.)
8
8
b. If the next three months show crime incidences in this area as
January 10 (out of 1,040 sampled)
February = 12 (out of 1,040 sampled)
March = 11 (out of 1,040 sampled)
What comments can you make regarding the crime rate?
Expert Solution
This question has been solved!
Explore an expertly crafted, step-by-step solution for a thorough understanding of key concepts.

This is a popular solution!

Trending now
This is a popular solution!

Step by step
Solved in 4 steps with 4 images

Recommended textbooks for you
Algebra and Trigonometry (MindTap Course List)
Algebra
ISBN:
9781305071742
Author:
James Stewart, Lothar Redlin, Saleem Watson
Publisher:
Cengage Learning
Algebra and Trigonometry (MindTap Course List)
Algebra
ISBN:
9781305071742
Author:
James Stewart, Lothar Redlin, Saleem Watson
Publisher:
Cengage Learning