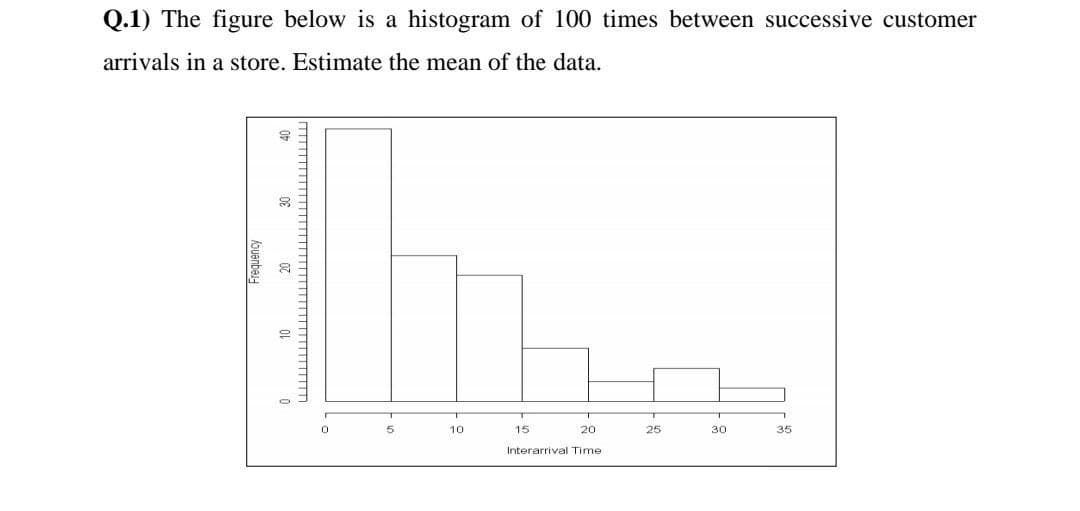
Q.1) The figure below is a histogram of 100 times between successive customer arrivals in a store. Estimate the mean of the data. 10 15 20 25 30 35 Interarrival Time OL louanbes
Q.1) The figure below is a histogram of 100 times between successive customer arrivals in a store. Estimate the mean of the data. 10 15 20 25 30 35 Interarrival Time OL louanbes

Glencoe Algebra 1, Student Edition, 9780079039897, 0079039898, 2018
18th Edition
ISBN:9780079039897
Author:Carter
Publisher:Carter
Chapter10: Statistics
Section10.3: Measures Of Spread
Problem 26PFA

Related questions
Question
I need answer within 20 minutes please please with my best wishes
Transcribed Image Text:Q.1) The figure below is a histogram of 100 times between successive customer
arrivals in a store. Estimate the mean of the data.
10
15
20
25
30
35
Interarrival Time
fouenbas
Expert Solution
This question has been solved!
Explore an expertly crafted, step-by-step solution for a thorough understanding of key concepts.

This is a popular solution!

Trending now
This is a popular solution!

Step by step
Solved in 2 steps with 2 images

Recommended textbooks for you
Glencoe Algebra 1, Student Edition, 9780079039897…
Algebra
ISBN:
9780079039897
Author:
Carter
Publisher:
McGraw Hill
Glencoe Algebra 1, Student Edition, 9780079039897…
Algebra
ISBN:
9780079039897
Author:
Carter
Publisher:
McGraw Hill