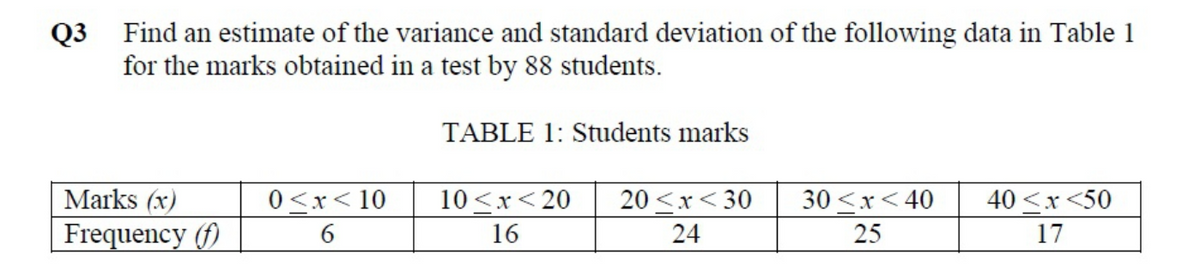
Q3 Find an estimate of the variance and standard deviation of the following data in Table 1 for the marks obtained in a test by 88 students. TABLE 1: Students marks Marks (x) 0


Q: Dex Research Limited conducted a research to investigate consumer characteristics that can be used…
A:
Q: In the goodness-of-fit measures, interpret the coefficient of determination for Earnings with Model…
A: For model coefficient of determination R2=0.7005 Interpretation of coefficient of…
Q: R programming 7. The associated R function is dlogis (x, location = 0, scale = 1) is for _________…
A: Question 7. The associated R function is dlogis (x, location = 0, scale = 1) is for _________…
Q: Bluereef real estate agent wants to form a relationship between the prices of houses, how many…
A: Answer :
Q: is this statement true? When outliers are important then it is important not to change the current…
A: answer is
Q: 2.4 Suppose that a hospital tested the age and body fat data for 18 randomly selected adults with…
A: we have number of option to get this so we get all solution in excel: a) mean median and standard…
Q: Suppose that (Y,. X) satisfy the assumptions specified here and in addition, u, is N (0, 2) and…
A:
Q: Q3/ Consider a bridge that is supported by three cables. The failure of interest is the failure of…
A: Solution :: Q.3.) Let's see first what is permutations and combinations called ? Answer ::…
Q: In this multiple regression output, which predictor variables have a statistically significant…
A: d. age, childrenYes, and sexMaleAccording to the findings of the multiple regression analysis, three…
Q: Solve in R programming language: Let the random variable X be defined on the support set (1,2) with…
A: P ( X < 1.25 ) = 0.09609375 E ( X ) = 1.65278 Var ( X ) = 0.06724452
Q: Observation data in X and Y are stated in the following table Y 2 1 7 Based on the data above: Find…
A: # Function to find the product termdef proterm(i, value, x): pro = 1; for j in…
Q: Q1. Use Linear Regression algorithm for the following data X Y 4 3 2 4 11 8 18 9
A: Code: format long x=[6 5 2 11 18]'; y=[4 3 4 8 9]'; %b1 is the slope or regression…
Q: If in the following dataframe, target' is our dependent variable; can we perform the Simple linear…
A:
Q: In an ANOVA test, a smal test statistic can be interpreted as that the variance samples was smaller…
A: Answer:
Q: b. Test for normality using a goodness of fit test. Report the goodness of fit p-value and state if…
A: Goodness of Fit Test: is a hypothesis test, in which we determine the data fits in a particular…
Q: If x has the binomial distribution with = 10 and Var(x) = 4, then the coefficient of variation is:…
A: Answer :-- 40%
Q: p) A federal agency studied the records about the number of job-related injuries at an underground…
A: Answer: Hypotheses are: H0: The underlying distribution is Poisson distribution. Ha: The underlying…
Q: Q4/ In an experiment to study the relationship of hypertension and smoking habits, the following…
A: Solution:
Q: Using R perform linear regression for the following data set and derive the equation. If the age is…
A: Q: Using R perform linear regression for the following data set and derive the equation. If the age…
Q: ļ 100 where: Ji=0> Problem 1. Implement KNN Regression algorithm from scratch. Dataset: {(x(), x(0)…
A: Note : Answering the question in python as no programming language is mentioned. Task : Given the…
Q: negative log likelihood
A: Below is solution code to calculate negative log likelihood, first we get mean and standard…
Q: 1. Let X~ Normal(, a²). Generate 5 samples of size 10,000 each for X. Compute the sample variance in…
A: Step 1 The answer is given in the below step.
Q: A regression analysis between y (sales in PHP1,000) and x (advertising in PHP1,000) resulted in the…
A: Given Regression equation y=80+5x
Q: • The following table (Training Dataset D) shows the midterm and final exam grades obtained for…
A: Note: As you have asked a multipart question, as per our policy, we will solve the first three parts…
Q: In a left-skewed distribution, which is greater? O a. standard deviation O b. variance O c. mode O…
A: If one tail is longer than the other, then the distribution is skewed. If the left tail is long,…
Q: Study 1 > table(gender) gender female male 109 91 > tapply (writing, gender, mean) female male…
A: Please find the answer below:
Q: What is the z-statistic in a hypothesis test for a single population mean given the following data?…
A: the answer is an given below ;
Q: Question 19 If R is a random variable on a sample space S and expected value E(R) = p, then the…
A: The variance of a random variable x , with mean Ex=μ , is defined as V(x)=E[(x-μ)2]
Q: Consider a population consişting of the measurements 0, 5 and 15. Assume the population is…
A: Solution:
Q: 4. The probability that a driver must stop at any one traffic light coming to IUKL is 0.2. What is…
A:
Q: Dex Research Limited conducted a research to investigate consumer characteristics that can be used…
A: Given Regression Statistics Multiple R 0.9086 R Square A…
Q: To examine whether there is any association between the performances on the two sests, T1 and T2…
A: It is defined as : A residual plot is a graph that shows the residuals on the vertical axis and the…
Q: The associated R function is dlogis (x, location = 0, scale = 1) is for _________ distribution. a)…
A: The correct answer is a. a) Logistic
Q: Question S A sample of size 18 has been collected from a normal population with variance 3, and is…
A: Given data are to find Confident interval: n= 18 , SD = 4.304201, Mean = 25.94444, 99% = 2.58…
Q: 1. Suppose X1,..., X, is a random sample from the Gamma(;, ) distribution. - Use the asymptotic…
A:
Q: Table 3.1 shows the training data for predicting if a tumor is malignant or non- malignant based on…
A: Given Data : Dataset with tumor size and label.
Q: Tuition($) Applicant Pool Applicant 950 76210 11040 1225…
A: (a). Determine the estimated multiple regression equation for the given data: Multiple linear…
Q: DATASET Find the linear regression equation of the variable against Y. of the i x_i y_i 1 8 5 10 3 2…
A:
Q: 4. Outliers can be detected using a statistical approach, one of popular approaches is the Inte…
A: data = [130,132,138,136,131,153,131,133,129,133,110,132,129,134,135,132,…
Q: 3.8 In a study designed to determine price sensitivity of the sales of Brand X, the following data…
A: Ans.) Brand X sales, mean correction: 1 - 0.5 0 - 0.5 0 - 0.5 -0.2 - 0.5 -0.8 - 0.3 -1.0 - -0.2 Ans:…
Q: For a given exam, there is 40% of the students passed math test, and 30% passed biology test, and…
A: conditional probability: The conditional probability of an event B is the probability that the event…
Q: 2. Suppose that a binary response variable Y is related to a set of predictors and a logistic model…
A: ROC CURVE- We can call ROC to curve i as a relative operating characteristic curve.We can create a…
Q: (a) Find the probability that a randomly selected study participant's response was less than 4. The…
A: Solution : Given that , mean = = 5.8 standard deviation = = 2.4
Q: Question 11: Suppose we have counted the number of individuals who purchase a specific new item and…
A: It is defined as a mathematical comparison between two numbers. According to proportion, if two…
Q: One student is selected at random. Let's define the following events: A = event the student selected…
A:
pls asnwer

Step by step
Solved in 2 steps with 2 images


- calculate mean median and mode for the following data pertaining to marks in statistics out of 140 marks for 80 students in a classThe R function for logistic regression is: Question 21 options: logit exp lm glmUsing R perform linear regression for the following data set and derive the equation. If the age is 12, predict what is the weight? Age 1 3 10 16 26 36Weight 22 30 50 60 70 75
- Apply the Excel Regression tool to the Demographics data using unemployment rate as the dependent variable and cost of living index as the independent variable. Interpret the output's major regression findings, hypothesis tests, and confidence intervals. Test the regression analysis assumptions using residuals. Check standard residuals for outliers.Consider the following Confusion Matrix: Actual (down) \ Predicted (across) Yes No Totals Yes 20 5 No 10 15 Totals Based on the given time to event data, what is the value of the cumulative distribution function at t=6 if there are 10 right-censored observations?Make a time series analysis about the data in table below. Make 2 or more regression models by using stata!
- In bivariate regression, the regression coefficient will be equal to rXY when:If the standard deviation of the vehicle speed crossing a road section is 5 mph. We want to estimate the mean speed within ±1.5 of the true value with 95% confidence. What would be the sample size for this study to address this objective?Question 91. Consider the following training set of m=4 training examples: x y 0.1 0.6 1 1.5 0 0.5 3 3.5 Consider the linear regression model hθ(x)=θ0+θ1x. What are the values of θ0 and θ1 that you would expect to obtain upon running gradient descent on this model? (Linear regression will be able to fit this data perfectly.)
- Person (SSN, Name, Surname, DateOfBirth, Gender) SerologicalTest (CodT, CommercialName, Brand, Reliability) Building(CodB, City, Province Region, MaxCapacity) UndergoTest (SSN, CodT, Date, CodB, Outcome) For each serological test brand, find the brand and the overall number of tests undergone from May 1st, 2020 to June 30th, 2020 to persons who have undergone at least two tests with the outcome “Positive” of that brand. this is the solution. SELECT Brand, COUNT(*) FROM SerologicalTest ST, UndergoTest UT WHERE ST.CodT = UT.CodT AND Date >= 01/05/2020 AND Date <= 30/06/2020 AND SSN IN ( Select SSN From UndergoTest UT2, SerologicalTest ST2 where ST2.CodT = UT2.CodT and outcome='positive' and ST2.Brand = ST.Brand group by SSN having COUNT(*) > 1) GROUP BY Brand but im struggling a lot to be able to solve these type of questions im not understanding how to think about it and if i can somehow do something on a paper before starting to…Consider the following regression equation specied for 2-period panel data: where i = 1; 2; :::N and t = 1; 2. If you expect that β_1 is positive, but the correlation between Δx_i and Δu_i is negative, then what is the bias in the OLS estimator of β_1 in the first-differenced equation? Already answered but wrong one so please don't copy pasteUSING R ONLY! Generate a sample from a theoretical linear regression: Z = 1.5X – 2.8Y – 4.3 N(0, 2.5^2). Then use the sample data to create a linear regression model to predict Z by X and Y. Interpret the regression results one by one and create residual plots to describe how to use each residual plot.