Refer to the diagram to the right. Initially, the aggregate expenditure curve is given by the following equation: AE = 400 +0.75Y The equilibrium level of income in this economy is equal to $ 1600. (Round your response to the nearest dollar.) Suppose the value of the marginal propensity to consume decreases to 0.60. 1. Use the line drawing tool to draw the new aggregate expenditure function. Label this line 'AE, . Make sure that the line starts at y-axis and extends to the right. 2. Use the point drawing tool to plot the new equilibrium level of income. Label this point 'E,'. Carefully follow the instructions above, and only draw the required objects. Desired Aggregate Expenditure 1,800- 1,500- 1,200- 900- 600+ 300- Aggregate Expenditure Function ok 0 E₁ ⠀ 1 1 I ⠀ : 400 800 1,200 1,600 Actual National Income Q 45%line Q AEG 2,000
Refer to the diagram to the right. Initially, the aggregate expenditure curve is given by the following equation: AE = 400 +0.75Y The equilibrium level of income in this economy is equal to $ 1600. (Round your response to the nearest dollar.) Suppose the value of the marginal propensity to consume decreases to 0.60. 1. Use the line drawing tool to draw the new aggregate expenditure function. Label this line 'AE, . Make sure that the line starts at y-axis and extends to the right. 2. Use the point drawing tool to plot the new equilibrium level of income. Label this point 'E,'. Carefully follow the instructions above, and only draw the required objects. Desired Aggregate Expenditure 1,800- 1,500- 1,200- 900- 600+ 300- Aggregate Expenditure Function ok 0 E₁ ⠀ 1 1 I ⠀ : 400 800 1,200 1,600 Actual National Income Q 45%line Q AEG 2,000

Chapter9: Demand-side Equilibrium: Unemployment Or Inflation?
Section9.A: The Simple Algebra Of Income Determination And The Multiplier
Problem 4TY

Related questions
Question
CS 24
Economics
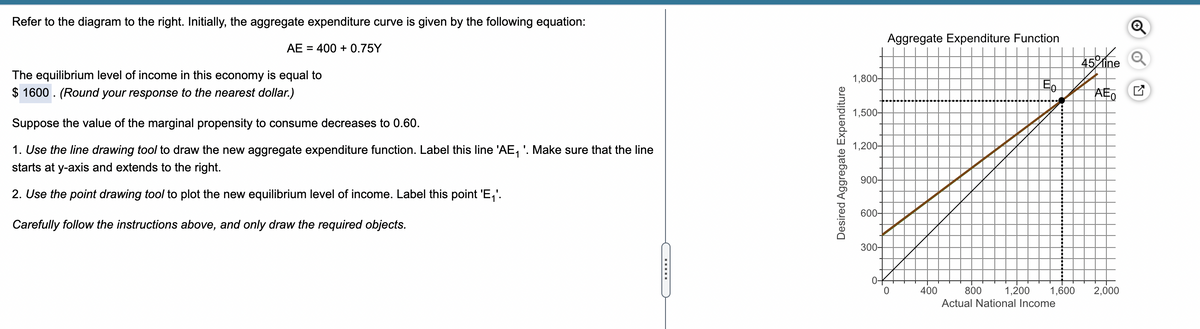
Transcribed Image Text:Refer to the diagram to the right. Initially, the aggregate expenditure curve is given by the following equation:
AE = 400 +0.75Y
The equilibrium level of income in this economy is equal to
$ 1600. (Round your response to the nearest dollar.)
Suppose the value of the marginal propensity to consume decreases to 0.60.
1. Use the line drawing tool to draw the new aggregate expenditure function. Label this line 'AE₁'. Make sure that the line
starts at y-axis and extends to the right.
2. Use the point drawing tool to plot the new equilibrium level of income. Label this point 'E₁'.
Carefully follow the instructions above, and only draw the required objects.
Desired Aggregate Expenditure
1,800-
1,500-
1,200-
900-
600-
300-
0+
Aggregate Expenditure Function
0
400
E₂
800
Actual National Income
1,200 1,600
45 Mine
21
AEO
2,000
Expert Solution
This question has been solved!
Explore an expertly crafted, step-by-step solution for a thorough understanding of key concepts.

This is a popular solution!

Trending now
This is a popular solution!

Step by step
Solved in 4 steps with 2 images

Knowledge Booster


Learn more about
Need a deep-dive on the concept behind this application? Look no further. Learn more about this topic, economics and related others by exploring similar questions and additional content below.Recommended textbooks for you


