samples exposed Dacter ghts bacteria, viruses, and tumors, was measured. Mean production went fr er tea drinking. The mean difference for the 5 subjects is 293 pg/mL with a s per implies that the use of the t-distribution is appropriate. ,et. al., "Antigens in tea-beverage prime human Vy2Vo2 T cells in vitro and kine responses," Proceedings of the National Academy of Sciences, May 13, 20


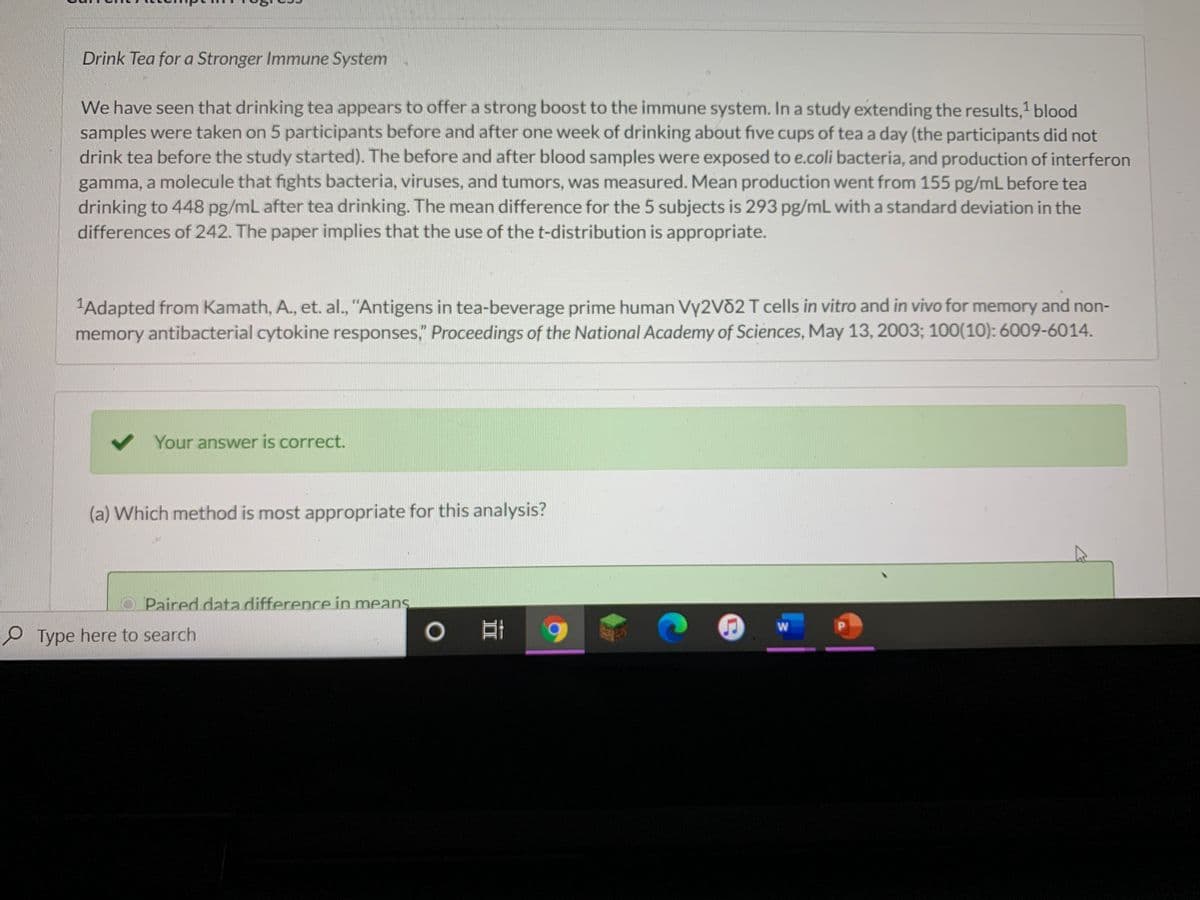
In the given scenario, the blood samples of 5 participants are taken before and after one week of drinking about five cups of tea a day.
Here, the same participants are taken before and after one week of drinking about five cups of tea a day.
The most appropriate method used for the analysis is paired data in difference of means.
Let n denote the number of subjects.
Let denote the mean difference of the subjects and denote the standard deviation in the differences.
That is, n = 5
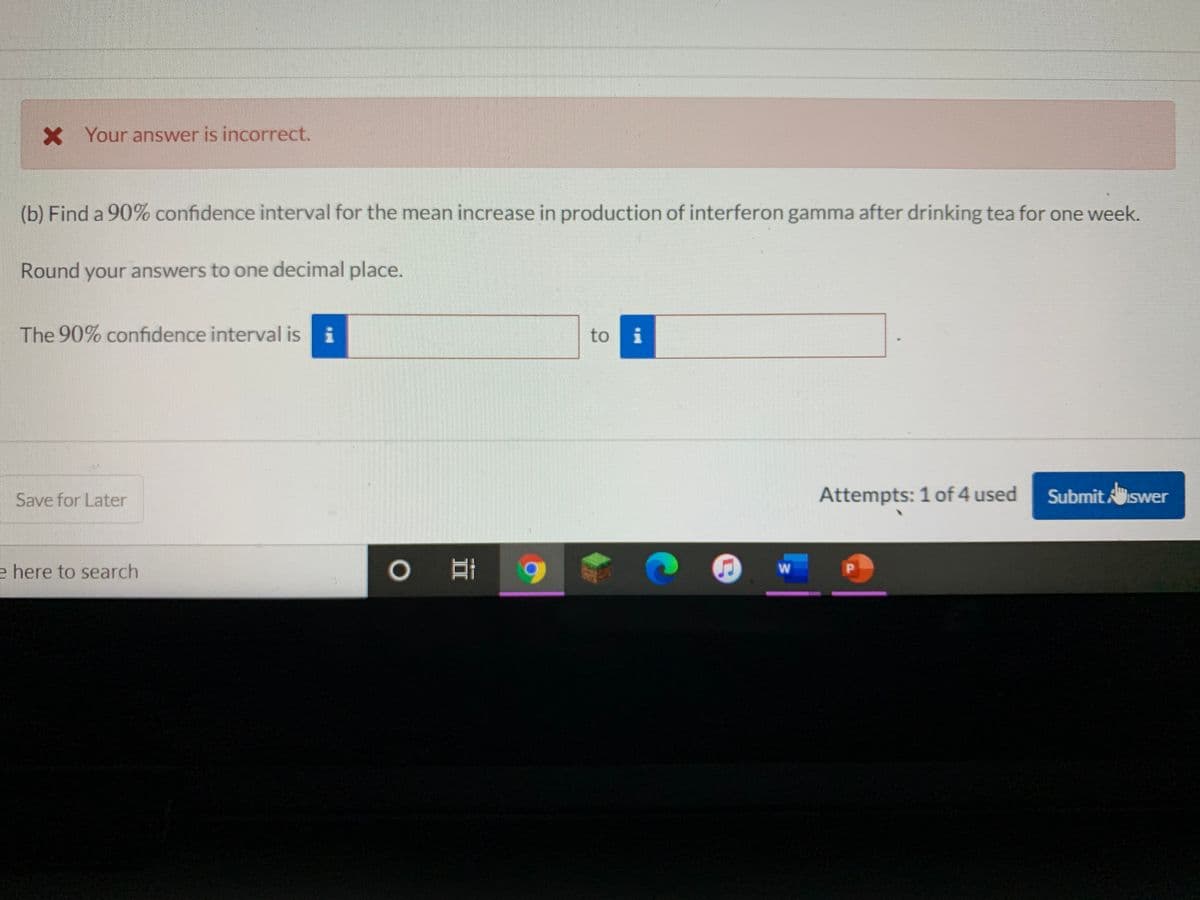
= 293 & = 242
The objective is to compute the 90% confidence interval for the mean .
The confidence level is,
C = 90%= 90/100= 0.90
The level of significance is,
The degrees of freedom is,
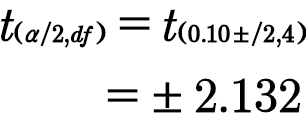
df = n-1= 5-1=4
from t table at 0.10 level of significance with 4 degrees of freedom the two- tailed critical value is,

Step by step
Solved in 2 steps with 2 images


