Shown to the right is a scatterplot of the error (in nautical miles) for predicting hurricane locations 72 hours in the future vs. the year in which the prediction (and the hurricane) occurred. Complete parts a and b. iClick the icon to view the regression analysis. Prediction Error (mi) 525- 100+ a) Explain in words and numbers what the regression says. Choose the correct answer below. According to the model, the error made in predicting a hurricane's path was about average, in 1970. It has been at a rate of about 35 0 Years (since 1970) nautical miles, on nautical miles per year.
Shown to the right is a scatterplot of the error (in nautical miles) for predicting hurricane locations 72 hours in the future vs. the year in which the prediction (and the hurricane) occurred. Complete parts a and b. iClick the icon to view the regression analysis. Prediction Error (mi) 525- 100+ a) Explain in words and numbers what the regression says. Choose the correct answer below. According to the model, the error made in predicting a hurricane's path was about average, in 1970. It has been at a rate of about 35 0 Years (since 1970) nautical miles, on nautical miles per year.

Glencoe Algebra 1, Student Edition, 9780079039897, 0079039898, 2018
18th Edition
ISBN:9780079039897
Author:Carter
Publisher:Carter
Chapter4: Equations Of Linear Functions
Section4.6: Regression And Median-fit Lines
Problem 6PPS

Related questions
Question
100%
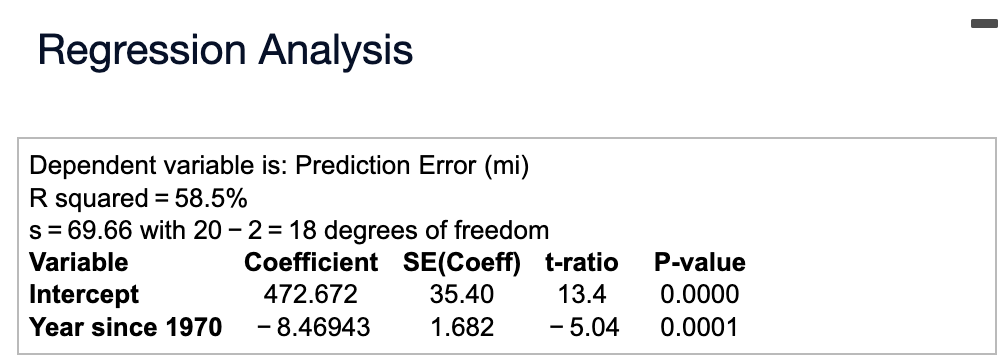
Transcribed Image Text:Regression Analysis
Dependent variable is: Prediction Error (mi)
R squared = 58.5%
s = 69.66 with 20 - 2 = 18 degrees of freedom
Variable
Intercept
Year since 1970
Coefficient SE(Coeff) t-ratio
472.672
35.40
13.4
- 8.46943
1.682
- 5.04
P-value
0.0000
0.0001
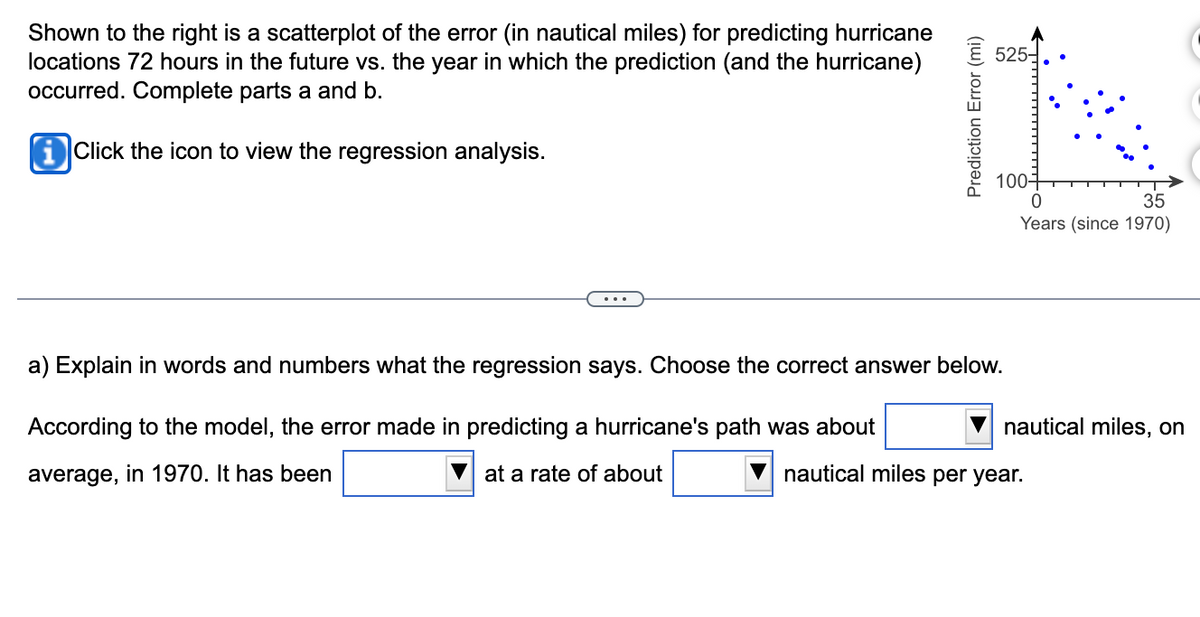
Transcribed Image Text:Shown to the right is a scatterplot of the error (in nautical miles) for predicting hurricane
locations 72 hours in the future vs. the year in which the prediction (and the hurricane)
occurred. Complete parts a and b.
Click the icon to view the regression analysis.
Prediction Error (mi)
525-
100-
a) Explain in words and numbers what the regression says. Choose the correct answer below.
According to the model, the error made in predicting a hurricane's path was about
average, in 1970. It has been
at a rate of about
35
0
Years (since 1970)
nautical miles, on
nautical miles per year.
Expert Solution
This question has been solved!
Explore an expertly crafted, step-by-step solution for a thorough understanding of key concepts.

This is a popular solution!

Trending now
This is a popular solution!

Step by step
Solved in 2 steps with 2 images

Recommended textbooks for you
Glencoe Algebra 1, Student Edition, 9780079039897…
Algebra
ISBN:
9780079039897
Author:
Carter
Publisher:
McGraw Hill


Glencoe Algebra 1, Student Edition, 9780079039897…
Algebra
ISBN:
9780079039897
Author:
Carter
Publisher:
McGraw Hill

Algebra & Trigonometry with Analytic Geometry
Algebra
ISBN:
9781133382119
Author:
Swokowski
Publisher:
Cengage

Trigonometry (MindTap Course List)
Trigonometry
ISBN:
9781305652224
Author:
Charles P. McKeague, Mark D. Turner
Publisher:
Cengage Learning

Functions and Change: A Modeling Approach to Coll…
Algebra
ISBN:
9781337111348
Author:
Bruce Crauder, Benny Evans, Alan Noell
Publisher:
Cengage Learning