Since the criteria for constructing a confidence interval for the population proportion p have been met, the confidence interval will have the following form where is the sample proportion, the z critical value captures the central area equal to the confidence level as a proportion, and n is the sample size. p ± (z critical value) p(1-p) n We have already determined p = 0.2 and n = 2,315, so must now determine the z critical value that will be used. For a 95% confidence interval, we will be capturing the central area of 0.95 under the z curve between -z* and z". To find z", recall the entire area under the z curve is 1. The remaining area of 1-0.95 = 0.05 will be split evenly between the lower and upper tails of the curve. That is, both the lower and upper tails of the curve will each have an area of (0.05) = [ x. This will be added to the central area of 0.95, so the total area to the left of the desired z is Use SALT to find the value of z, rounding the result to two decimal places.
Since the criteria for constructing a confidence interval for the population proportion p have been met, the confidence interval will have the following form where is the sample proportion, the z critical value captures the central area equal to the confidence level as a proportion, and n is the sample size. p ± (z critical value) p(1-p) n We have already determined p = 0.2 and n = 2,315, so must now determine the z critical value that will be used. For a 95% confidence interval, we will be capturing the central area of 0.95 under the z curve between -z* and z". To find z", recall the entire area under the z curve is 1. The remaining area of 1-0.95 = 0.05 will be split evenly between the lower and upper tails of the curve. That is, both the lower and upper tails of the curve will each have an area of (0.05) = [ x. This will be added to the central area of 0.95, so the total area to the left of the desired z is Use SALT to find the value of z, rounding the result to two decimal places.

Glencoe Algebra 1, Student Edition, 9780079039897, 0079039898, 2018
18th Edition
ISBN:9780079039897
Author:Carter
Publisher:Carter
Chapter4: Equations Of Linear Functions
Section: Chapter Questions
Problem 8SGR

Related questions
Question
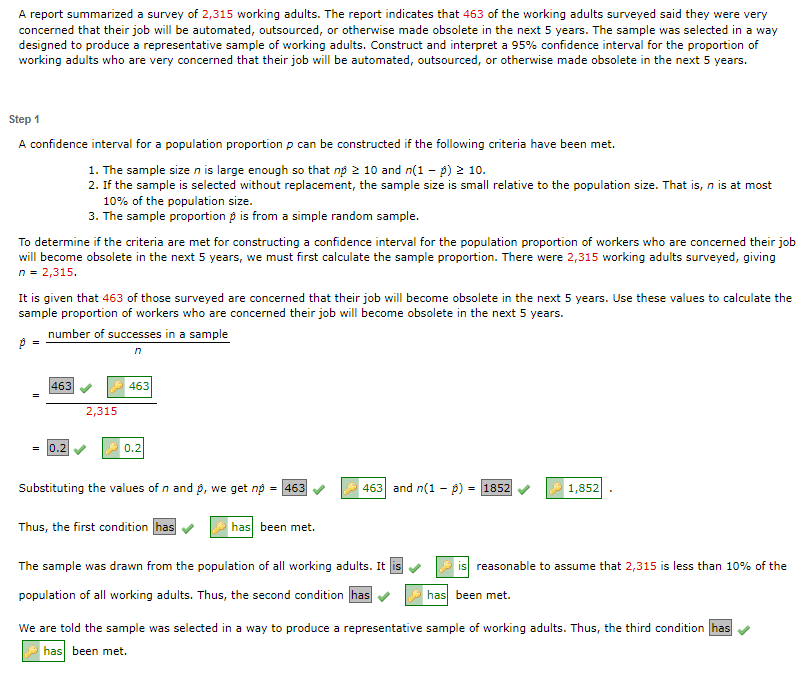
Transcribed Image Text:A report summarized a survey of 2,315 working adults. The report indicates that 463 of the working adults surveyed said they were very
concerned that their job will be automated, outsourced, or otherwise made obsolete in the next 5 years. The sample was selected in a way
designed to produce a representative sample of working adults. Construct and interpret a 95% confidence interval for the proportion of
working adults who are very concerned that their job will be automated, outsourced, or otherwise made obsolete in the next 5 years.
Step 1
A confidence interval for a population proportion p can be constructed if the following criteria have been met.
1. The sample size n is large enough so that no 2 10 and n(1 - p) 2 10.
2. If the sample is selected without replacement, the sample size is small relative to the population size. That is, n is at most
10% of the population size.
3. The sample proportion p is from a simple random sample.
To determine if the criteria are met for constructing a confidence interval for the population proportion of workers who are concerned their job
will become obsolete in the next 5 years, we must first calculate the sample proportion. There were 2,315 working adults surveyed, giving
n = 2,315.
It is given that 463 of those surveyed are concerned that their job will become obsolete in the next 5 years. Use these values to calculate the
sample proportion of workers who are concerned their job will become obsolete in the next 5 years.
P
=
number of successes in a sample
n
463
0.2
2,315
463
0.2
Substituting the values of n and p, we get nø = 463
Thus, the first condition has
has been met.
463 and n(1 p) = 1852
1,852
is reasonable to assume that 2,315 is less than 10% of the
has been met.
The sample was drawn from the population of all working adults. It
population of all working adults. Thus, the second condition has
We are told the sample was selected in a way to produce a representative sample of working adults. Thus, the third condition has
has been met.
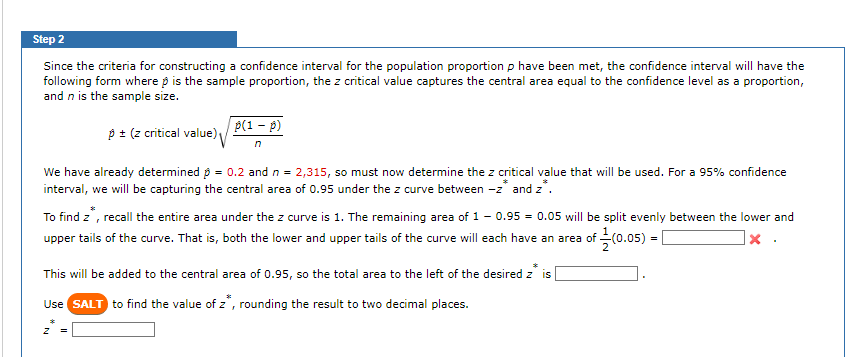
Transcribed Image Text:Step 2
Since the criteria for constructing a confidence interval for the population proportion p have been met, the confidence interval will have the
following form where is the sample proportion, the z critical value captures the central area equal to the confidence level as a proportion,
and n is the sample size.
p ± (z critical value)
p(1 - p)
We have already determined p = 0.2 and n = 2,315, so must now determine the z critical value that will be used. For a 95% confidence
interval, we will be capturing the central area of 0.95 under the z curve between -z* and z*.
To find z*, recall the entire area under the z curve is 1. The remaining area of 1-0.95 = 0.05 will be split evenly between the lower and
upper tails of the curve. That is, both the lower and upper tails of the curve will each have an area of (0.05) =
X
z
This will be added to the central area of 0.95, so the total area to the left of the desired z is
Use SALT to find the value of z, rounding the result to two decimal places.
Expert Solution
This question has been solved!
Explore an expertly crafted, step-by-step solution for a thorough understanding of key concepts.

Step by step
Solved in 2 steps with 1 images

Recommended textbooks for you
Glencoe Algebra 1, Student Edition, 9780079039897…
Algebra
ISBN:
9780079039897
Author:
Carter
Publisher:
McGraw Hill

College Algebra (MindTap Course List)
Algebra
ISBN:
9781305652231
Author:
R. David Gustafson, Jeff Hughes
Publisher:
Cengage Learning
Glencoe Algebra 1, Student Edition, 9780079039897…
Algebra
ISBN:
9780079039897
Author:
Carter
Publisher:
McGraw Hill
College Algebra (MindTap Course List)
Algebra
ISBN:
9781305652231
Author:
R. David Gustafson, Jeff Hughes
Publisher:
Cengage Learning