Suppose there is some hypothetical closed economy in which households spend $0.75 of each additional dollar they earn and save the remaining $0.25. The marginal propensity to consume (MPC) for this economy is, and the spending multiplier for this economy is. Suppose the government in this economy decides to decrease government purchases by $250 billion. The decrease in government spending will lead to a decrease in income, creating an initial change in consumption equal to ▼. This decreases income yet again, leading to a second change in consumption equal to . The total change in demand resulting from the initial change in government spending is The following graph shows the aggregate demand curve (AD₁) for this economy before the change in government spending. Use the green line (triangle symbol) to plot the new aggregate demand curve (AD₂) after the multiplier effect takes place. For simplicity, assume that there is no "crowding out." Hint: Be sure that the new aggregate demand curve (AD₂) is parallel to the initial aggregate demand curve (AD₁). You can see the slope of AD₁ by selecting it on the graph.
Suppose there is some hypothetical closed economy in which households spend $0.75 of each additional dollar they earn and save the remaining $0.25. The marginal propensity to consume (MPC) for this economy is, and the spending multiplier for this economy is. Suppose the government in this economy decides to decrease government purchases by $250 billion. The decrease in government spending will lead to a decrease in income, creating an initial change in consumption equal to ▼. This decreases income yet again, leading to a second change in consumption equal to . The total change in demand resulting from the initial change in government spending is The following graph shows the aggregate demand curve (AD₁) for this economy before the change in government spending. Use the green line (triangle symbol) to plot the new aggregate demand curve (AD₂) after the multiplier effect takes place. For simplicity, assume that there is no "crowding out." Hint: Be sure that the new aggregate demand curve (AD₂) is parallel to the initial aggregate demand curve (AD₁). You can see the slope of AD₁ by selecting it on the graph.

Chapter19: The Keynesian Model In Action
Section: Chapter Questions
Problem 7SQP

Related questions
Question
100%
Transcribed Image Text:Use the green line (triangle symbol) to plot the new aggregate demand curve (AD₂) after the multiplier effect takes place. For simplicity, assume that
there is no "crowding out."
Hint: Be sure that the new aggregate demand curve (AD₂) is parallel to the initial aggregate demand curve (AD₁). You can see the slope of AD₁ by
selecting it on the graph.
PRICE LEVEL
140
135
130
125
120
115
110
105
100
O
9
AD₁
1
1
3
4
5
OUTPUT (Trillions of dollars)
2
6
7
8
AD₂
?
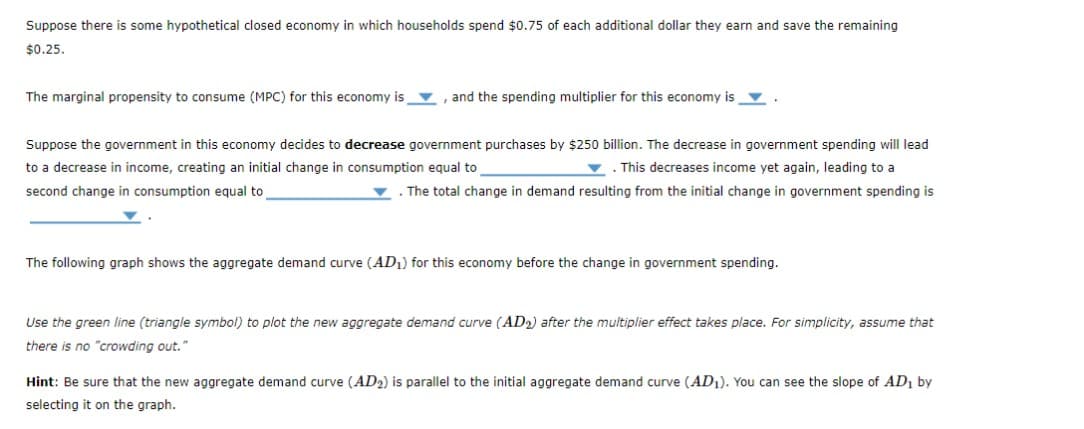
Transcribed Image Text:Suppose there is some hypothetical closed economy in which households spend $0.75 of each additional dollar they earn and save the remaining
$0.25.
The marginal propensity to consume (MPC) for this economy is, and the spending multiplier for this economy is.
Suppose the government in this economy decides to decrease government purchases by $250 billion. The decrease in government spending will lead
to a decrease in income, creating an initial change in consumption equal to
This decreases income yet again, leading to a
second change in consumption equal to
The total change in demand resulting from the initial change in government spending is
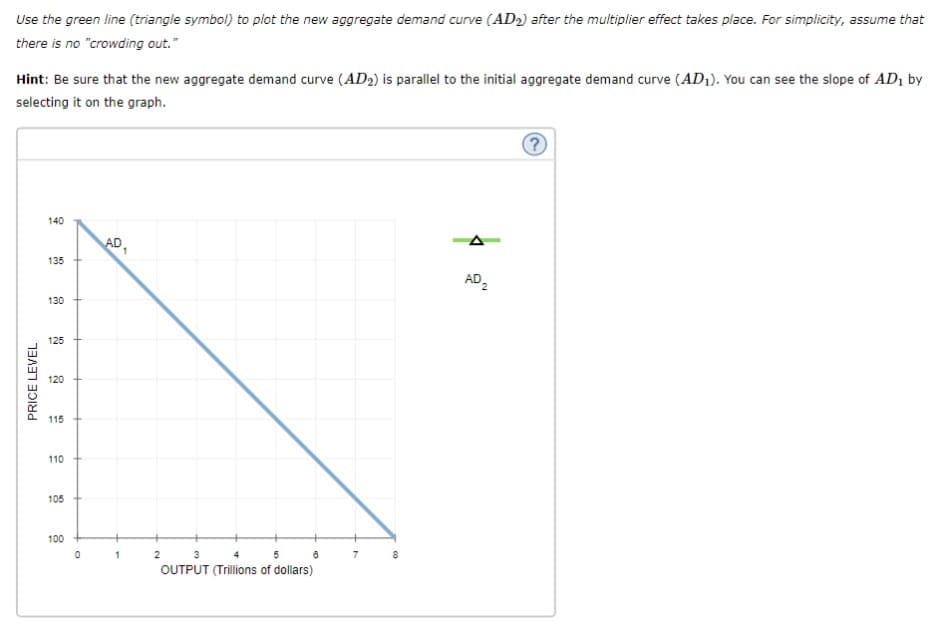
The following graph shows the aggregate demand curve (AD₁) for this economy before the change in government spending.
Use the green line (triangle symbol) to plot the new aggregate demand curve (AD2) after the multiplier effect takes place. For simplicity, assume that
there is no "crowding out."
Hint: Be sure that the new aggregate demand curve (AD₂) is parallel to the initial aggregate demand curve (AD₁). You can see the slope of AD₁ by
selecting it on the graph.
Expert Solution
This question has been solved!
Explore an expertly crafted, step-by-step solution for a thorough understanding of key concepts.

This is a popular solution!

Trending now
This is a popular solution!

Step by step
Solved in 5 steps with 2 images

Knowledge Booster


Learn more about
Need a deep-dive on the concept behind this application? Look no further. Learn more about this topic, economics and related others by exploring similar questions and additional content below.Recommended textbooks for you


Exploring Economics
Economics
ISBN:
9781544336329
Author:
Robert L. Sexton
Publisher:
SAGE Publications, Inc

Economics (MindTap Course List)
Economics
ISBN:
9781337617383
Author:
Roger A. Arnold
Publisher:
Cengage Learning