Suppose there is some hypothetical economy in which households spend $0.50 of each additional dollar they earn and save the $0.50 they have left over. The following graph plots the economy's initial aggregate demand curve (ADI). Suppose now that the government increases its purchases by $3.5 billion. Use the green line (triangle symbol) on the following graph to show the aggregate demand curve (AD) after the multiplier effect takes place. Hint: Be sure the new aggregate demand curve (AD) is parallel to AD₁. You can see the slope of AD, by selecting it on the following graph. PRICE LEVEL 116 114 112 110 108 106 104 102 AD 100 100 102 104 106 108 110 OUTPUT (Billions of dollars) 112 114 116 AD₂ | | AD₂ The following graph plots equilibrium in the money market at an interest rate of 3% and a quantity of money equal to $30 billion. Show the impact of the increase in government purchases on the interest rate by shifting one or both of the curves on the following graph. Money Supply Money Demand Money Demand 10 201 30 40 50 MONEY (Billions of dollars) 一 Money Supply Suppose that for every increase in the interest rate of one percentage point, the level of investment spending declines by $2 billion. Based on the changes made to the money market in the previous scenario, the new interest rate causes the level of investment spending to by Should the government use monetary and fiscal policy in an effort to stabilize the economy? The following questions address the issue of how monetary and fiscal policies affect the economy, as well as the pros and cons of using these tools to combat economic fluctuations. The following graph plots hypothetical aggregate demand (AD), short-run aggregate supply (AS), and long-run aggregate supply (LRAS) curves for the U.S. economy in February 2026. Suppose the government chooses to intervene in order to return the economy to the natural level of output by using policy. Depending on which curve is affected by the government policy, shift either the AS curve or the AD curve to reflect the change that would successfully restore the natural level of output.
Suppose there is some hypothetical economy in which households spend $0.50 of each additional dollar they earn and save the $0.50 they have left over. The following graph plots the economy's initial aggregate demand curve (ADI). Suppose now that the government increases its purchases by $3.5 billion. Use the green line (triangle symbol) on the following graph to show the aggregate demand curve (AD) after the multiplier effect takes place. Hint: Be sure the new aggregate demand curve (AD) is parallel to AD₁. You can see the slope of AD, by selecting it on the following graph. PRICE LEVEL 116 114 112 110 108 106 104 102 AD 100 100 102 104 106 108 110 OUTPUT (Billions of dollars) 112 114 116 AD₂ | | AD₂ The following graph plots equilibrium in the money market at an interest rate of 3% and a quantity of money equal to $30 billion. Show the impact of the increase in government purchases on the interest rate by shifting one or both of the curves on the following graph. Money Supply Money Demand Money Demand 10 201 30 40 50 MONEY (Billions of dollars) 一 Money Supply Suppose that for every increase in the interest rate of one percentage point, the level of investment spending declines by $2 billion. Based on the changes made to the money market in the previous scenario, the new interest rate causes the level of investment spending to by Should the government use monetary and fiscal policy in an effort to stabilize the economy? The following questions address the issue of how monetary and fiscal policies affect the economy, as well as the pros and cons of using these tools to combat economic fluctuations. The following graph plots hypothetical aggregate demand (AD), short-run aggregate supply (AS), and long-run aggregate supply (LRAS) curves for the U.S. economy in February 2026. Suppose the government chooses to intervene in order to return the economy to the natural level of output by using policy. Depending on which curve is affected by the government policy, shift either the AS curve or the AD curve to reflect the change that would successfully restore the natural level of output.

Chapter9: Demand-side Equilibrium: Unemployment Or Inflation?
Section9.A: The Simple Algebra Of Income Determination And The Multiplier
Problem 4TY

Related questions
Question
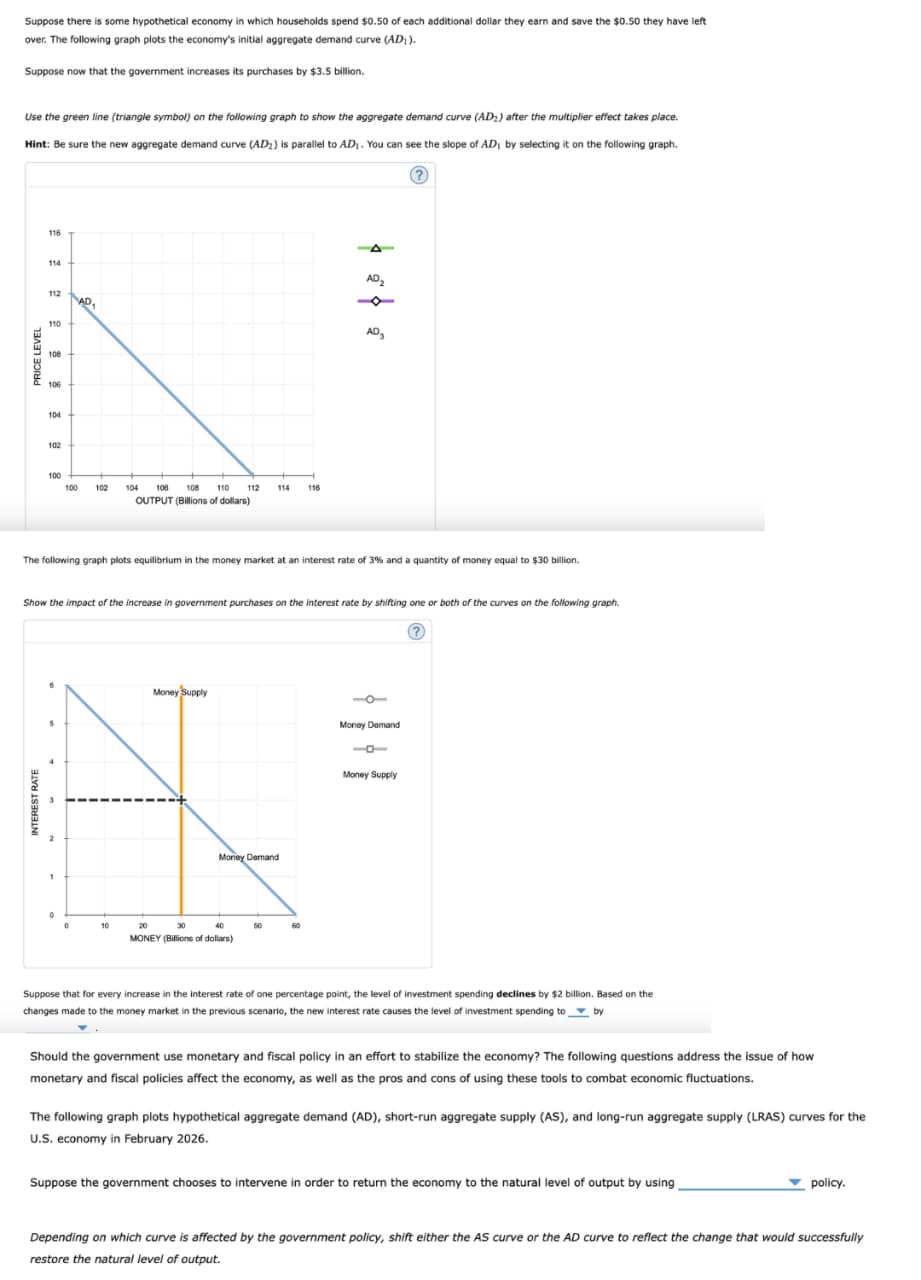
Transcribed Image Text:Suppose there is some hypothetical economy in which households spend $0.50 of each additional dollar they earn and save the $0.50 they have left
over. The following graph plots the economy's initial aggregate demand curve (ADI).
Suppose now that the government increases its purchases by $3.5 billion.
Use the green line (triangle symbol) on the following graph to show the aggregate demand curve (AD) after the multiplier effect takes place.
Hint: Be sure the new aggregate demand curve (AD) is parallel to AD₁. You can see the slope of AD, by selecting it on the following graph.
PRICE LEVEL
116
114
112
110
108
106
104
102
AD
100
100
102
104 106 108 110
OUTPUT (Billions of dollars)
112
114
116
AD₂
| |
AD₂
The following graph plots equilibrium in the money market at an interest rate of 3% and a quantity of money equal to $30 billion.
Show the impact of the increase in government purchases on the interest rate by shifting one or both of the curves on the following graph.
Money Supply
Money Demand
Money Demand
10
201
30
40
50
MONEY (Billions of dollars)
一
Money Supply
Suppose that for every increase in the interest rate of one percentage point, the level of investment spending declines by $2 billion. Based on the
changes made to the money market in the previous scenario, the new interest rate causes the level of investment spending to by
Should the government use monetary and fiscal policy in an effort to stabilize the economy? The following questions address the issue of how
monetary and fiscal policies affect the economy, as well as the pros and cons of using these tools to combat economic fluctuations.
The following graph plots hypothetical aggregate demand (AD), short-run aggregate supply (AS), and long-run aggregate supply (LRAS) curves for the
U.S. economy in February 2026.
Suppose the government chooses to intervene in order to return the economy to the natural level of output by using
policy.
Depending on which curve is affected by the government policy, shift either the AS curve or the AD curve to reflect the change that would successfully
restore the natural level of output.
Expert Solution
This question has been solved!
Explore an expertly crafted, step-by-step solution for a thorough understanding of key concepts.

This is a popular solution!

Trending now
This is a popular solution!

Step by step
Solved in 2 steps

Recommended textbooks for you


Macroeconomics: Principles and Policy (MindTap Co…
Economics
ISBN:
9781305280601
Author:
William J. Baumol, Alan S. Blinder
Publisher:
Cengage Learning