
ENGR.ECONOMIC ANALYSIS
14th Edition
ISBN: 9780190931919
Author: NEWNAN
Publisher: Oxford University Press
expand_more
expand_more
format_list_bulleted
Related questions
Question
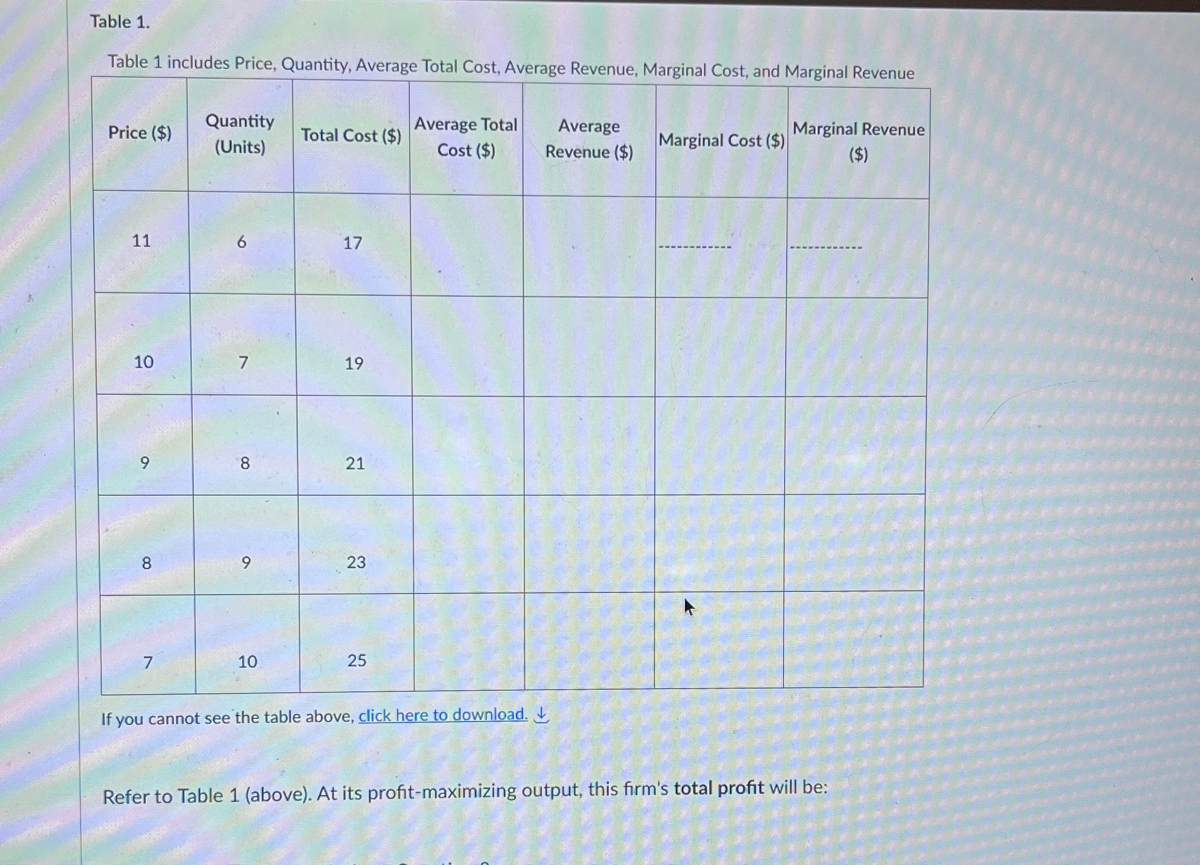

Transcribed Image Text:Table 1.
Table 1 includes Price, Quantity, Average Total Cost, Average Revenue, Marginal Cost, and Marginal Revenue
Price ($)
11
10
a
8
7
Quantity
(Units)
6
7
8
9
10
Total Cost ($)
17
19
21
23
25
Average Total
Cost ($)
If you cannot see the table above, click here to download.
Average
Revenue ($)
Marginal Cost ($)
Marginal Revenue
($)
Refer to Table 1 (above). At its profit-maximizing output, this firm's total profit will be:
Expert Solution
This question has been solved!
Explore an expertly crafted, step-by-step solution for a thorough understanding of key concepts.

This is a popular solution

Trending nowThis is a popular solution!

Step by stepSolved in 3 steps

Knowledge Booster

Similar questions
- Draw , label , and briefly explain the following diagrams. You are welcome to write any accompanying text by hand. 9. Explain how Apple Cinnamon Cheerios profit maximisation can be represented in terms of an iso profit curve and a demand curve, as well as marginal revenue = marginal cost.Please explain how this diagram awnsers this questionarrow_forwardSub : EconomicsPls answer very fast.I ll upvote. Thank Youarrow_forwardThe graph below plots the firm's total revenue curve: that is, the relationship between quantity and total revenue given by the two right columns in the table above. The five choices are also labeled. Finally, two black lines are shown; these lines are tangent to the green curve at points B and D. 90 81 72 63 54 В D 45 36 27 18 A E 100 200 300 400 500 600 700 800 QUANTITY (Dishwashers per year) TOTAL REVENUE (Thousands of dollars per year)arrow_forward
- On the graph input tool, change the number found in the Quantity Demanded field to determine the prices that correspond to the production of 0, 6, 12, 15, 18, 24, and 30 units of output. Calculate the total revenue for each of these production levels. Then, on the following graph, use the green points (triangle symbol) to plot the results. Calculate the total revenue if the firm produces 6 versus 5 units. Then, calculate the marginal revenue of the sixth unit produced. The marginal revenue of the sixth unit produced is________. Calculate the total revenue if the firm produces 12 versus 11 units. Then, calculate the marginal revenue of the 12th unit produced. The marginal revenue of the 12th unit produced is_________.arrow_forwardCalculate Iyana's marginal revenue and marginal cost for the first seven rompers they produce, and plot them on the following graph. Use the blue points (circle symbol) to plot marginal revenue and the orange points (square symbol) to plot marginal cost at each quantity. COSTS AND REVENUE (Dollars per romper) 40 35 30 25 20 15 10 0 0 1 2 3 4 5 6 7 8 QUANTITY (Rompers) Marginal Revenue Marginal Cost ? Iyana's profit is maximized when they produce a total of is $ , an amount rompers. At this quantity, the marginal cost of the final romper they produce than the price received for each romper they sell. At this point, the marginal cost of producing one more romper (the first romper beyond the profit maximizing quantity) is $ , an amount than the price received for each romper they sell. Therefore, Iyana's profit-maximizing quantity occurs at the point of intersection between the Because Iyana is a price taker, the previous condition is equivalent to curves.arrow_forward9. Problems and Applications Q9 The market for apple pies in the city of Ectenia is competitive and has the following demand schedule: Each producer in the market has a fixed cost of $6 and the following marginal cost: Quantity Marginal Cost (Dollars) 1 1 2 3 4 5 6 Complete the following table by computing the total cost and average total cost for each quantity produced. Quantity Total Cost Average Total Cost (Ples) (Dollars) (Dollars) 1 2 3 4 3 8 10 12 14 The price of a pie is now $11. At a price of $11, making a profit of O True O Fal pies are sold in the market. Each producer makes True or False: The market is in long-run equilibrium. Suppose that in the long run there is free entry and exit. In the long run, each producer earns a profit of each producer makes pies, so there are The market price is producers operating. pies, so there are At this price, producers in this market, each pies are sold in this market, andarrow_forward
- i need the answer quicklyarrow_forwardThe next 6 questions relate to the following table. Calculate total revenue at a quantity of 5 units. (The table gives you Quantity, Price, and Total Costs, leaving the Total Revenue and Profit for you to calculate.) Quantity Price Total Revenue Total Cost Profit 0 70 0 1 70 60 2 70 120 3 70 180 4 70 300 5 70 410 Calculate profit at an output of 4 units. What is the highest profit possible? What is the profit maximizing level of output What is the profit maximizing price? Can you tell if this is the short run or long run? Explain.arrow_forwardGiocattolo is a profit-maximizing firm producing toy cars, which it can produce and sell in its home country, Italy, and abroad in Spain. The average cost (AC) curve on the following graph represents Giocattolo's cost of producing toy cars within one factory, whether in Italy or in Spain. COST (Dollars per toy car) 20 18 16 14 12 10 8 4 2 0 0 10 20 30 40 50 60 70 80 QUANTITY (Thousands of toy cars) AC 90 100 Suppose that at the current market price of toy cars, the demand for Giocattolo's product is 10,000 toy cars per year in Italy and 20,000 toy cars per year in Spain. (Hint: Select each point on the previous graph to see its coordinates.) Based on Giocattolo's average cost curve, within one factory it can produce 20,000 toy cars at $ per toy car, and produce the total of 30,000 toy cars at $ per toy car. per car, produce 10,000 toy cars atarrow_forward
- a. 3 b. 9 c. 2 d. 10 e. 5arrow_forwardUse the data from the following demand schedule to answer the questions that follow. Price (P) (Dollars) Quantity Demanded (Q) Total Revenue (TR) (Dollars) Marginal Revenue (MR) (Dollars) 24.00 0 0.00 21.60 21.60 1 21.60 16.80 19.20 2 38.40 12.00 16.80 3 50.40 7.20 14.40 4 57.60 2.40 12.00 5 60.00 -2.40 9.60 6 57.60 -7.20 7.20 7 50.40 -12.00 4.80 8 38.40 -16.80 2.40 9 21.60 -21.60 0.00 10 0.00 Make the unrealistic assumption that production is costless for the monopolist in this question. The monopolist will charge a price of $ for the monopolist. per unit and sell units. This will yield an economic profit of $ Now assume the marginal cost is above zero and is equal to the marginal revenue of the fourth unit. The monopolist will now charge monopolist will now earn price and produce when production was costless. In turn, the economic profit compared to when production was costless. Grade It Now Save & Continuearrow_forwardPlease answer F and show steps for the grapharrow_forward
arrow_back_ios
SEE MORE QUESTIONS
arrow_forward_ios
Recommended textbooks for you
 Principles of Economics (12th Edition)EconomicsISBN:9780134078779Author:Karl E. Case, Ray C. Fair, Sharon E. OsterPublisher:PEARSON
 Engineering Economy (17th Edition)EconomicsISBN:9780134870069Author:William G. Sullivan, Elin M. Wicks, C. Patrick KoellingPublisher:PEARSON
 Principles of Economics (MindTap Course List)EconomicsISBN:9781305585126Author:N. Gregory MankiwPublisher:Cengage Learning
 Managerial Economics: A Problem Solving ApproachEconomicsISBN:9781337106665Author:Luke M. Froeb, Brian T. McCann, Michael R. Ward, Mike ShorPublisher:Cengage Learning
 Managerial Economics & Business Strategy (Mcgraw-...EconomicsISBN:9781259290619Author:Michael Baye, Jeff PrincePublisher:McGraw-Hill Education
Principles of Economics (12th Edition)
Economics
ISBN:9780134078779
Author:Karl E. Case, Ray C. Fair, Sharon E. Oster
Publisher:PEARSON
Engineering Economy (17th Edition)
Economics
ISBN:9780134870069
Author:William G. Sullivan, Elin M. Wicks, C. Patrick Koelling
Publisher:PEARSON
Principles of Economics (MindTap Course List)
Economics
ISBN:9781305585126
Author:N. Gregory Mankiw
Publisher:Cengage Learning
Managerial Economics: A Problem Solving Approach
Economics
ISBN:9781337106665
Author:Luke M. Froeb, Brian T. McCann, Michael R. Ward, Mike Shor
Publisher:Cengage Learning
Managerial Economics & Business Strategy (Mcgraw-...
Economics
ISBN:9781259290619
Author:Michael Baye, Jeff Prince
Publisher:McGraw-Hill Education