The 95% confidence interval is to This means that you are % confident that the unknown difference between the mean daily caloric intake of the population of college juniors and the population of college sophomores is located within this interval. Use the tool to construct a 90% confidence interval for the population mean difference. The 90% confidence interval is This means that you are % confident that the unknown difference between the mean daily caloric intake of the population of college juniors and the population of college sophomores is located within this interval. The new confidence interval is than the original one, because the new level of confidence is than the original one.
The 95% confidence interval is to This means that you are % confident that the unknown difference between the mean daily caloric intake of the population of college juniors and the population of college sophomores is located within this interval. Use the tool to construct a 90% confidence interval for the population mean difference. The 90% confidence interval is This means that you are % confident that the unknown difference between the mean daily caloric intake of the population of college juniors and the population of college sophomores is located within this interval. The new confidence interval is than the original one, because the new level of confidence is than the original one.

Glencoe Algebra 1, Student Edition, 9780079039897, 0079039898, 2018
18th Edition
ISBN:9780079039897
Author:Carter
Publisher:Carter
Chapter4: Equations Of Linear Functions
Section: Chapter Questions
Problem 8SGR

Related questions
Question
Take your time answer the questions, this is all one question, please answer correctly, thank you very much, will write an wonderful review when solutions are done.
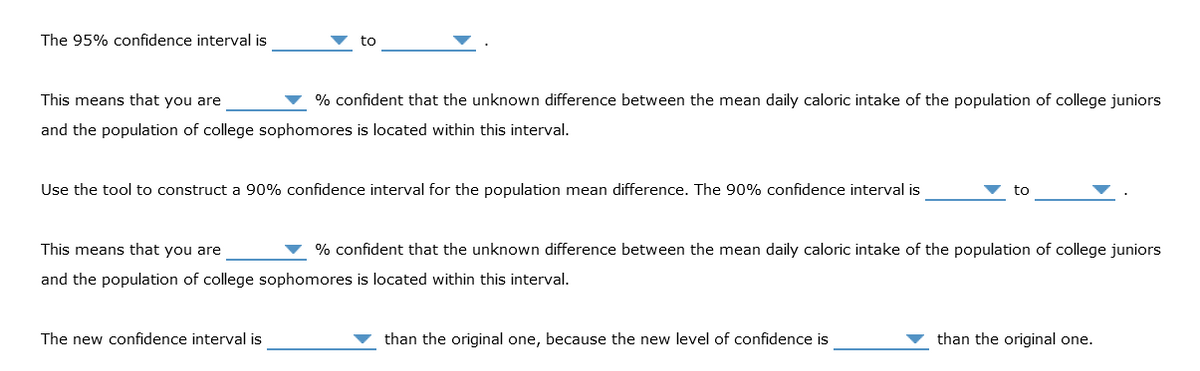
Transcribed Image Text:The 95% confidence interval is
to
This means that you are
% confident that the unknown difference between the mean daily caloric intake of the population of college juniors
and the population of college sophomores is located within this interval.
Use the tool to construct a 90% confidence interval for the population mean difference. The 90% confidence interval is
This means that you are
% confident that the unknown difference between the mean daily caloric intake of the population of college juniors
and the population of college sophomores is located within this interval.
The new confidence interval is
than the original one, because the new level of confidence is
than the original one.
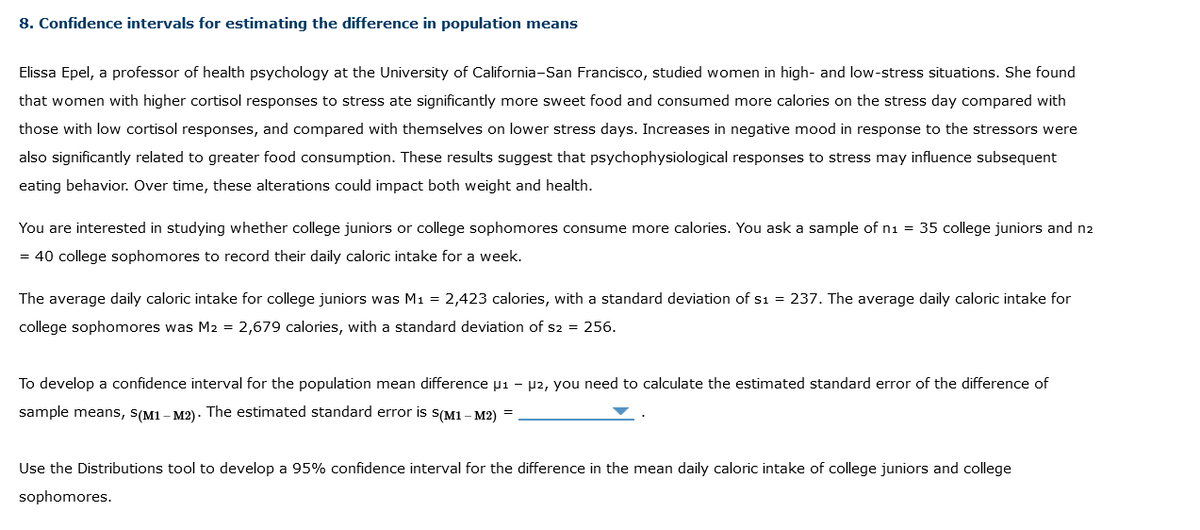
Transcribed Image Text:8. Confidence intervals for estimating the difference in population means
Elissa Epel, a professor of health psychology at the University of California-San Francisco, studied women in high- and low-stress situations. She found
that women with higher cortisol responses to stress ate significantly more sweet food and consumed more calories on the stress day compared with
those with low cortisol responses, and compared with themselves on lower stress days. Increases in negative mood in response to the stressors were
also significantly related to greater food consumption. These results suggest that psychophysiological responses to stress may influence subsequent
eating behavior. Over time, these alterations could impact both weight and health.
You are interested in studying whether college juniors or college sophomores consume more calories. You ask a sample of n₁ = 35 college juniors and n2
= 40 college sophomores to record their daily caloric intake for a week.
The average daily caloric intake for college juniors was M₁ = 2,423 calories, with a standard deviation of s1 = 237. The average daily caloric intake for
college sophomores was M2 = 2,679 calories, with a standard deviation of s2 = 256.
To develop a confidence interval for the population mean difference μ₁ - μ2, you need to calculate the estimated standard error of the difference of
sample means, S(M1-M2). The estimated standard error is S(M1-M2) =
Use the Distributions tool to develop a 95% confidence interval for the difference in the mean daily caloric intake of college juniors and college
sophomores.
Expert Solution
This question has been solved!
Explore an expertly crafted, step-by-step solution for a thorough understanding of key concepts.

This is a popular solution!

Trending now
This is a popular solution!

Step by step
Solved in 4 steps

Recommended textbooks for you
Glencoe Algebra 1, Student Edition, 9780079039897…
Algebra
ISBN:
9780079039897
Author:
Carter
Publisher:
McGraw Hill
Glencoe Algebra 1, Student Edition, 9780079039897…
Algebra
ISBN:
9780079039897
Author:
Carter
Publisher:
McGraw Hill