t yt 1 54 2 50 3 46 4 51 5 45 6 56 7 69 8 65 9 83 10 80 11 96 12 91 13 93 14 90 15 85 16 88 17 83 18 70 19 66 20 62 The accompanying data file contains 20 observations for t and yt. Click here for the Excel Data File a. Use the 3-period moving average for making forecasts. Note: Do not round intermediate calculations. Round final answers to 2 decimal places. t Ут ŷt 1 54 2 50 3 46 4 51 5 45 20 20 62 62 b. Use the in-sample forecast errors to compute MSE, MAD, and MAPE. Note: Do not round intermediate calculations. Round final answers to 2 decimal places. Value Performance Measure MSE MAD MAPE (%) c. Make a forecast for period 21. Note: Do not round intermediate calculations. Round final answer to 2 decimal places. ŷ21
t yt 1 54 2 50 3 46 4 51 5 45 6 56 7 69 8 65 9 83 10 80 11 96 12 91 13 93 14 90 15 85 16 88 17 83 18 70 19 66 20 62 The accompanying data file contains 20 observations for t and yt. Click here for the Excel Data File a. Use the 3-period moving average for making forecasts. Note: Do not round intermediate calculations. Round final answers to 2 decimal places. t Ут ŷt 1 54 2 50 3 46 4 51 5 45 20 20 62 62 b. Use the in-sample forecast errors to compute MSE, MAD, and MAPE. Note: Do not round intermediate calculations. Round final answers to 2 decimal places. Value Performance Measure MSE MAD MAPE (%) c. Make a forecast for period 21. Note: Do not round intermediate calculations. Round final answer to 2 decimal places. ŷ21

Practical Management Science
6th Edition
ISBN:9781337406659
Author:WINSTON, Wayne L.
Publisher:WINSTON, Wayne L.
Chapter13: Regression And Forecasting Models
Section13.6: Moving Averages Models
Problem 22P: The file P13_22.xlsx contains total monthly U.S. retail sales data. While holding out the final six...

Related questions
Question
100%
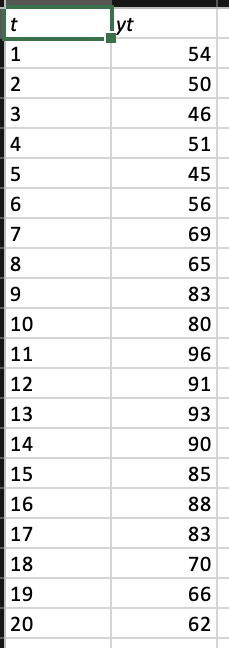
Transcribed Image Text:t
yt
1
54
2
50
3
46
4
51
5
45
6
56
7
69
8
65
9
83
10
80
11
96
12
91
13
93
14
90
15
85
16
88
17
83
18
70
19
66
20
62
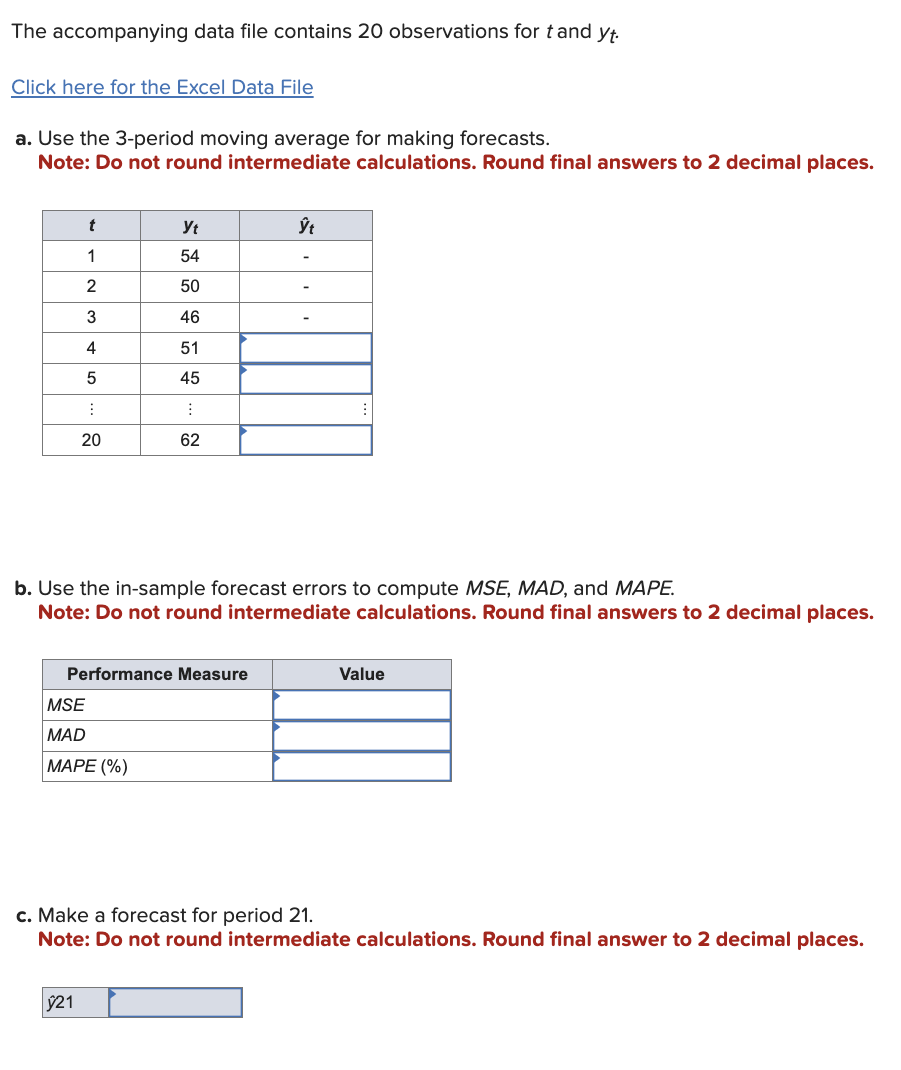
Transcribed Image Text:The accompanying data file contains 20 observations for t and yt.
Click here for the Excel Data File
a. Use the 3-period moving average for making forecasts.
Note: Do not round intermediate calculations. Round final answers to 2 decimal places.
t
Ут
ŷt
1
54
2
50
3
46
4
51
5
45
20
20
62
62
b. Use the in-sample forecast errors to compute MSE, MAD, and MAPE.
Note: Do not round intermediate calculations. Round final answers to 2 decimal places.
Value
Performance Measure
MSE
MAD
MAPE (%)
c. Make a forecast for period 21.
Note: Do not round intermediate calculations. Round final answer to 2 decimal places.
ŷ21
Expert Solution
This question has been solved!
Explore an expertly crafted, step-by-step solution for a thorough understanding of key concepts.

Step by step
Solved in 2 steps with 3 images

Recommended textbooks for you
Practical Management Science
Operations Management
ISBN:
9781337406659
Author:
WINSTON, Wayne L.
Publisher:
Cengage,
Practical Management Science
Operations Management
ISBN:
9781337406659
Author:
WINSTON, Wayne L.
Publisher:
Cengage,