The bar graph shows that life expectancy, the number of years newborns are expected to live, in a particular region has increased dramatically since ancient times. Find the percent increase in average life expectancy of the region from the Stone Age to 2016. 80- 70- 71 62 60- 51 50- 40- 31 33 30 30- 26 20- 10- Stone Age Ancient Middle Greece Ages 1900 1950 1980 2016 Time Period/Year ...... (Round to the nearest integer as needed.) Average Life Expectancy (years)
The bar graph shows that life expectancy, the number of years newborns are expected to live, in a particular region has increased dramatically since ancient times. Find the percent increase in average life expectancy of the region from the Stone Age to 2016. 80- 70- 71 62 60- 51 50- 40- 31 33 30 30- 26 20- 10- Stone Age Ancient Middle Greece Ages 1900 1950 1980 2016 Time Period/Year ...... (Round to the nearest integer as needed.) Average Life Expectancy (years)

Chapter4: Linear Functions
Section4.3: Fitting Linear Models To Data
Problem 24SE: Table 6 shows the year and the number ofpeople unemployed in a particular city for several years....

Related questions
Question
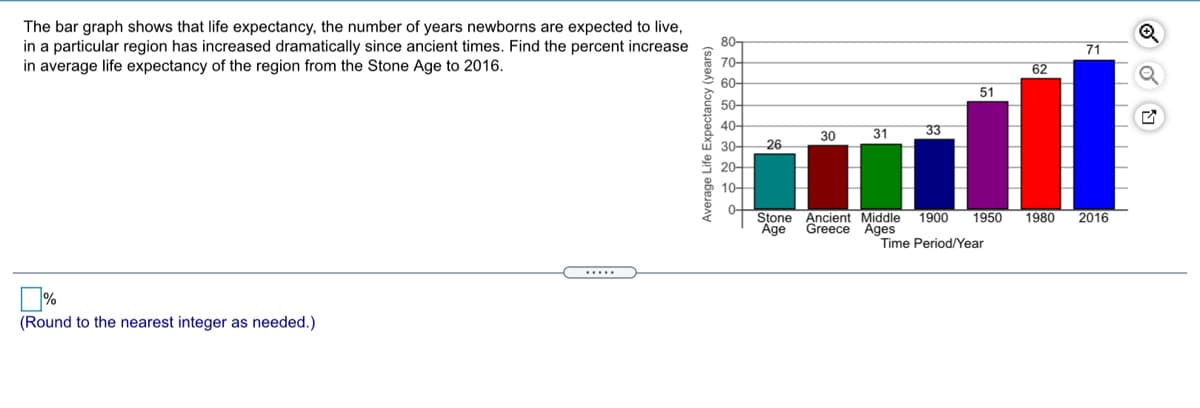
Transcribed Image Text:The bar graph shows that life expectancy, the number of years newborns are expected to live,
in a particular region has increased dramatically since ancient times. Find the percent increase
in average life expectancy of the region from the Stone Age to 2016.
80-
70-
60-
71
62
51
50-
40-
31
33
30
30-
26
20-
10-
Ancient Middle
Greece Ages
1950
Stone
Age
1980
2016
1900
Time Period/Year
(Round to the nearest integer as needed.)
Average Life Expectancy (years)
Expert Solution
This question has been solved!
Explore an expertly crafted, step-by-step solution for a thorough understanding of key concepts.

This is a popular solution!

Trending now
This is a popular solution!

Step by step
Solved in 2 steps with 2 images

Recommended textbooks for you

College Algebra (MindTap Course List)
Algebra
ISBN:
9781305652231
Author:
R. David Gustafson, Jeff Hughes
Publisher:
Cengage Learning

College Algebra (MindTap Course List)
Algebra
ISBN:
9781305652231
Author:
R. David Gustafson, Jeff Hughes
Publisher:
Cengage Learning


Algebra & Trigonometry with Analytic Geometry
Algebra
ISBN:
9781133382119
Author:
Swokowski
Publisher:
Cengage

Glencoe Algebra 1, Student Edition, 9780079039897…
Algebra
ISBN:
9780079039897
Author:
Carter
Publisher:
McGraw Hill