
Glencoe Algebra 1, Student Edition, 9780079039897, 0079039898, 2018
18th Edition
ISBN: 9780079039897
Author: Carter
Publisher: McGraw Hill
expand_more
expand_more
format_list_bulleted
Related questions
Question
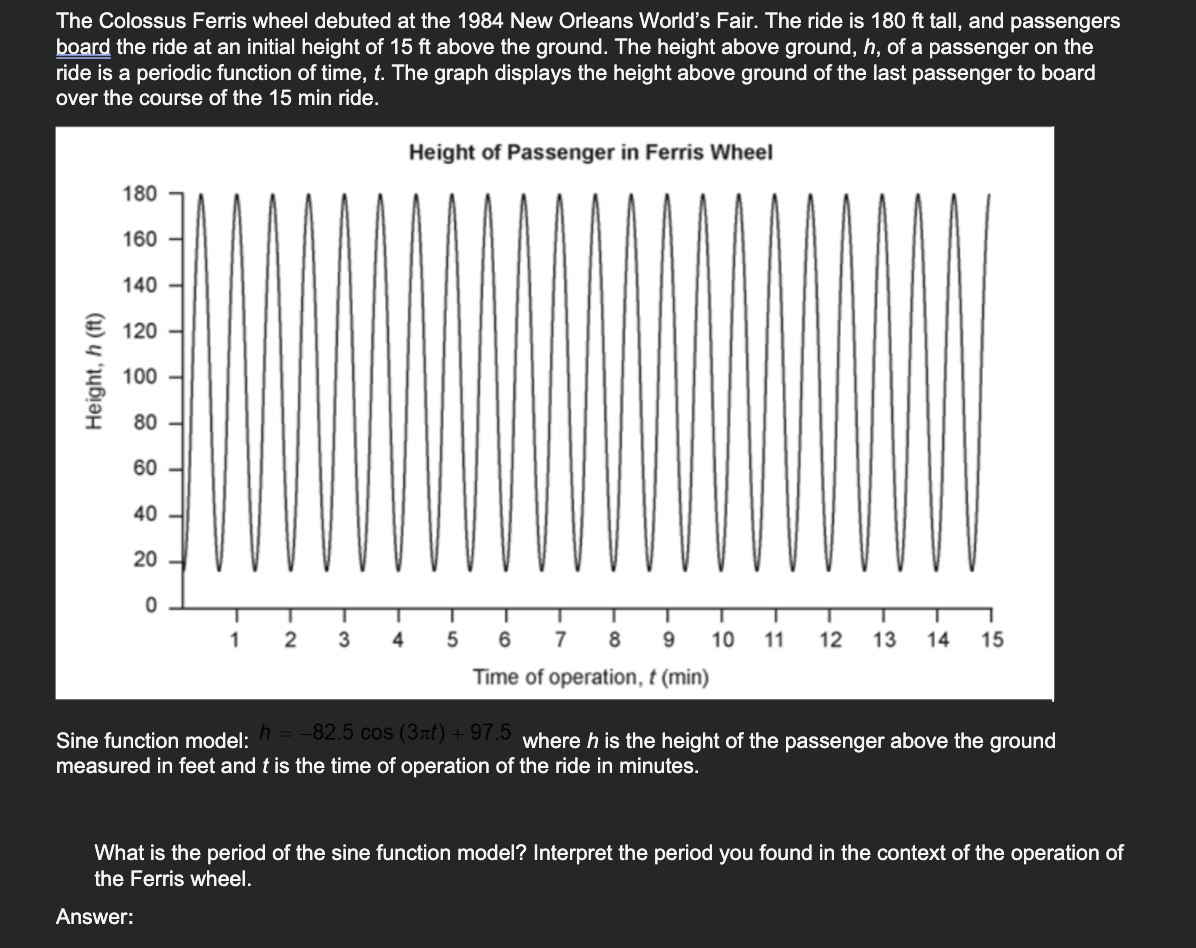

Transcribed Image Text:The Colossus Ferris wheel debuted at the 1984 New Orleans World's Fair. The ride is 180 ft tall, and passengers
board the ride at an initial height of 15 ft above the ground. The height above ground, h, of a passenger on the
ride is a periodic function of time, t. The graph displays the height above ground of the last passenger to board
over the course of the 15 min ride.
Height of Passenger in Ferris Wheel
180
160
140-
€120
Height, h (ft)
100
80
60
40
20
0
ך
1
2
3
4
5
6
7 8 9
10
11
12 13
14
15
Time of operation, t (min)
Sine function model: h = −82.5 cos (3πt) + 97.5 where h is the height of the passenger above the ground
measured in feet and t is the time of operation of the ride in minutes.
What is the period of the sine function model? Interpret the period you found in the context of the operation of
the Ferris wheel.
Answer:
Expert Solution
This question has been solved!
Explore an expertly crafted, step-by-step solution for a thorough understanding of key concepts.

Step by stepSolved in 2 steps with 2 images

Knowledge Booster

Similar questions
- Quinn retumed home one suummer's day to firdit sweatinducingly hott He tumed the air conditioner on and fell asloop. The room's temperature decreased by 0.5 Celsis each minute, and Quinn woke up 6 minutes later when it was 10 Celsius Graph the relationship between the room's temperature (in degrees Celsun) and time (in minutes. Temperature (deg. Celsius) 45+ 40 35+ 30arrow_forwardThe gas mileage of a car (in miles per gallon) is highest when the car is going about 45 miles per hour and is lower when the car is going faster or slower than 45 mph. Graph gas mileage as a function of speed of the car.arrow_forwardA science class experiment changing the temperature of an object by a constant rate over a period of time. The experiment began with a termperature of -10°F and ended after 8 minutes at a temperature of 0°F Which graph represents the same relationship between temperature, Y, and time, x?arrow_forward
- Which graph represents a one-to-one function?arrow_forwardSection 4: Functions A plant is already 14 centimeters tall, and it will grow one centimeter every month. Let H be the plant's height (in centimeters) after M months. Write an equation relating H to M. Then graph your equation using the axes below.arrow_forwardThe number of times working out in a month varies inversely to the number of pounds lost the first month. What is the graph that represents the equation for working out 3 times when losing two pounds? -10 -5 10 -5 -10 -10 -5 5. 10 -10 10 -5 10 -10 10 40 -5 5 10arrow_forward
- The graph shows the depth in feet of the water in Discover Bay over the course of a particular day. During this day, Discover Bay experienced high tide three times. At what time would you expect the first high tide to occur the following day?arrow_forwardthe operating expesnes of amazon increased from 3.6 billion in 2008 to 16.3 billion in 2012. use the information to find a linear model for amazons operating expesne E as a function of time t in years since 2010arrow_forwardDraw a graph that pictures the following situation. Identify the independent and dependent variables. Determine the intervals on which the dependent variable is increasing, decreasing, or constant. A woman left her office at 7:30 to attend a meeting. After walking for 3 minutes, she realized she forgot her notes and returned to get them. She picked up her notes and resumed her walk to the meeting, arriving at 8:00. After 14 minutes, the meeting was over and the woman returned to her office. Assume that the woman walks from the place of the meeting back to her office at the same speed with which she walks from her office to the place of the meeting after picking up her notes. Draw a graph that pictures the given situation. Choose the correct graph below. OA. OB. Oc. OD. AD AC Identify the independent and dependent variables. O A. The independent variable is the time t and the dependent variable is the distance D. O B. The independent variable is the distance D and the dependent variable…arrow_forward
arrow_back_ios
SEE MORE QUESTIONS
arrow_forward_ios
Recommended textbooks for you
- Glencoe Algebra 1, Student Edition, 9780079039897...AlgebraISBN:9780079039897Author:CarterPublisher:McGraw Hill
 Algebra: Structure And Method, Book 1AlgebraISBN:9780395977224Author:Richard G. Brown, Mary P. Dolciani, Robert H. Sorgenfrey, William L. ColePublisher:McDougal Littell
 College Algebra (MindTap Course List)AlgebraISBN:9781305652231Author:R. David Gustafson, Jeff HughesPublisher:Cengage Learning
  Algebra & Trigonometry with Analytic GeometryAlgebraISBN:9781133382119Author:SwokowskiPublisher:Cengage
Glencoe Algebra 1, Student Edition, 9780079039897...
Algebra
ISBN:9780079039897
Author:Carter
Publisher:McGraw Hill
Algebra: Structure And Method, Book 1
Algebra
ISBN:9780395977224
Author:Richard G. Brown, Mary P. Dolciani, Robert H. Sorgenfrey, William L. Cole
Publisher:McDougal Littell
College Algebra (MindTap Course List)
Algebra
ISBN:9781305652231
Author:R. David Gustafson, Jeff Hughes
Publisher:Cengage Learning
Algebra & Trigonometry with Analytic Geometry
Algebra
ISBN:9781133382119
Author:Swokowski
Publisher:Cengage