The data in the accompanying table represent the heights and weights of a random sample of professional baseball players. Complete parts (a) through (c) below. Click the icon to view the data table. (a) Draw a scatter diagram of the data, treating height as the explanatory variable and weight as the response variable. Choose the correct graph below. O B. O A. 240-1 210- 180- # 70 76 Height (inches) OA. Ho: B₁ = 0 H₁: B₁ #0 OB. Ho: B=0 Họ: Boo 82 OC. Ho: B₂ = 0 Họ: By 0 O D. Ho: B₁ = 0 H₁: B₂ > 0 240- 210- Test whether there is a linear relation between height and weight at the a= 0.05 level of significance. State the null and alternative hypotheses. Choose the correct answer below. Determine the P-value for this hypothesis test. 180- (b) Determine the least-squares regression line. Test whether there is a linear relation between height and weight at the a= 0.05 level of significance. Determine the least-squares regression line. Choose the correct answer below. O A. y=8.058x-93.9 O B. y - 93.9x +4.058 OC. y 4.058x-95.9 O D. y 4.058x-93.9 70 76 82 Height (inches) Q Q G Player Player 1 Player 2 Player 3 Player 4 Player 5 Player 6 Player 7 OC. Player 8 Player 9 bight (pounds) 240- 210- 180- Players' Heights and Weights 70 76 Height (inches) Print Height (inches) Weight (pounds) 75 227 75 195 72 12 180 231 185 190 228 200 230 82 82 82 69 74 75 71 75 Done B - X
The data in the accompanying table represent the heights and weights of a random sample of professional baseball players. Complete parts (a) through (c) below. Click the icon to view the data table. (a) Draw a scatter diagram of the data, treating height as the explanatory variable and weight as the response variable. Choose the correct graph below. O B. O A. 240-1 210- 180- # 70 76 Height (inches) OA. Ho: B₁ = 0 H₁: B₁ #0 OB. Ho: B=0 Họ: Boo 82 OC. Ho: B₂ = 0 Họ: By 0 O D. Ho: B₁ = 0 H₁: B₂ > 0 240- 210- Test whether there is a linear relation between height and weight at the a= 0.05 level of significance. State the null and alternative hypotheses. Choose the correct answer below. Determine the P-value for this hypothesis test. 180- (b) Determine the least-squares regression line. Test whether there is a linear relation between height and weight at the a= 0.05 level of significance. Determine the least-squares regression line. Choose the correct answer below. O A. y=8.058x-93.9 O B. y - 93.9x +4.058 OC. y 4.058x-95.9 O D. y 4.058x-93.9 70 76 82 Height (inches) Q Q G Player Player 1 Player 2 Player 3 Player 4 Player 5 Player 6 Player 7 OC. Player 8 Player 9 bight (pounds) 240- 210- 180- Players' Heights and Weights 70 76 Height (inches) Print Height (inches) Weight (pounds) 75 227 75 195 72 12 180 231 185 190 228 200 230 82 82 82 69 74 75 71 75 Done B - X

Glencoe Algebra 1, Student Edition, 9780079039897, 0079039898, 2018
18th Edition
ISBN:9780079039897
Author:Carter
Publisher:Carter
Chapter10: Statistics
Section10.6: Summarizing Categorical Data
Problem 42PFA

Related questions
Question
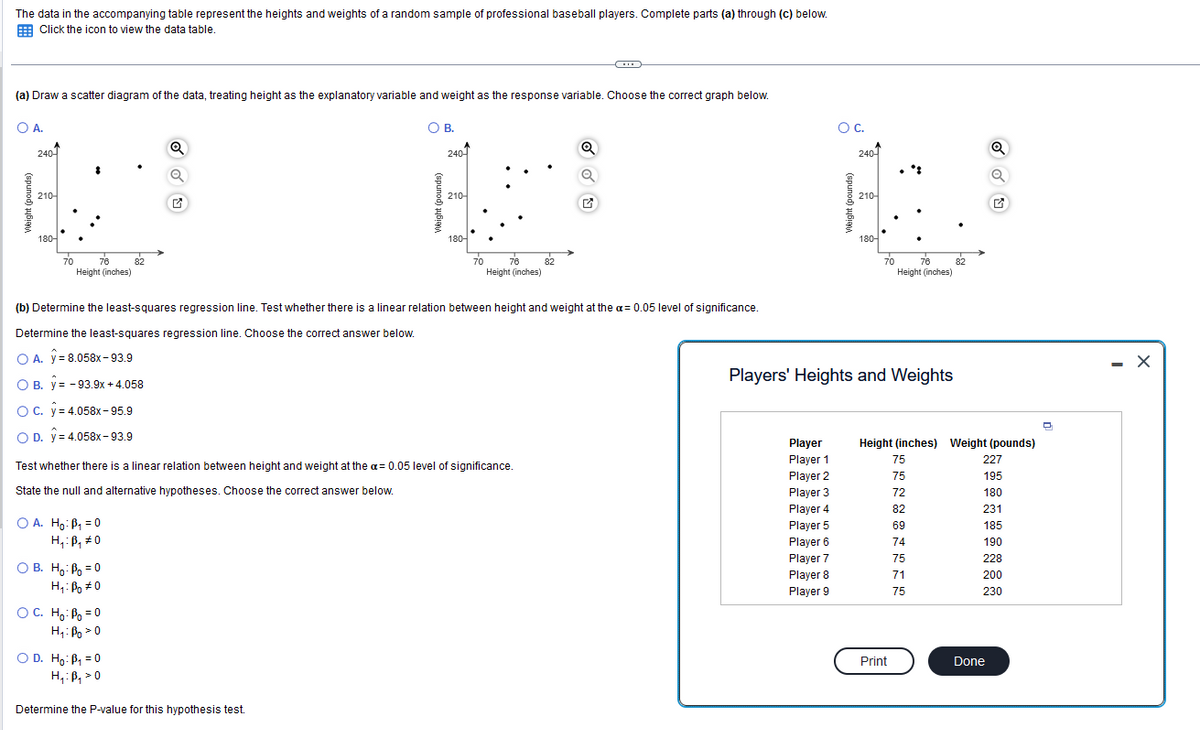
Transcribed Image Text:The data in the accompanying table represent the heights and weights of a random sample of professional baseball players. Complete parts (a) through (c) below.
Click the icon to view the data table.
(a) Draw a scatter diagram of the data, treating height as the explanatory variable and weight as the response variable. Choose the correct graph below.
O A.
Weight (pounds)
240-
210-
180-
70
8
76
Height (inches)
O C. y = 4.058x-95.9
O D. y = 4.058x-93.9
O A. Ho: B₁ = 0
H₁: B₁ 0
82
OB. Ho: B=0
Hi Boto
G
OC. H₂: B = 0
Hi: Bozo
O B.
Weight (pounds)
O D. Ho: B₁ = 0
H₁: B₁ 0
Determine the P-value for this hypothesis test.
240-
210-
Test whether there is a linear relation between height and weight at the a= 0.05 level of significance.
State the null and alternative hypotheses. Choose the correct answer below.
180-
(b) Determine the least-squares regression line. Test whether there is a linear relation between height and weight at the a= 0.05 level of significance.
Determine the least-squares regression line. Choose the correct answer below.
O A. y = 8.058x-93.9
O B. y = -93.9x + 4.058
70 76
Height (inches)
82
Q
Q
4
Player
Player 1
Player 2
Player 3
Player 4
Player 5
Player 6
Player 7
OC.
Player 8
Player 9
240-
210-
180-
Players' Heights and Weights
70
76
Height (inches)
Print
Height (inches) Weight (pounds)
75
75
72
82
69
74
75
82
71
75
227
195
180
231
185
190
228
200
230
Done
- X
Expert Solution
This question has been solved!
Explore an expertly crafted, step-by-step solution for a thorough understanding of key concepts.

This is a popular solution!

Trending now
This is a popular solution!

Step by step
Solved in 8 steps with 5 images

Recommended textbooks for you
Glencoe Algebra 1, Student Edition, 9780079039897…
Algebra
ISBN:
9780079039897
Author:
Carter
Publisher:
McGraw Hill
Glencoe Algebra 1, Student Edition, 9780079039897…
Algebra
ISBN:
9780079039897
Author:
Carter
Publisher:
McGraw Hill