
ENGR.ECONOMIC ANALYSIS
14th Edition
ISBN: 9780190931919
Author: NEWNAN
Publisher: Oxford University Press
expand_more
expand_more
format_list_bulleted
Related questions
Question
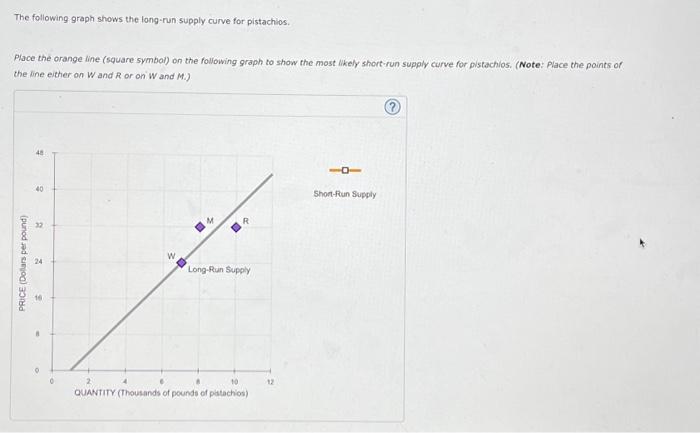

Transcribed Image Text:The following graph shows the long-run supply curve for pistachios.
Place the orange line (square symbol) on the following graph to show the most likely short-run supply curve for pistachios. (Note: Place the points of
the line either on W and R or on W and M.)
PRICE (Dollars per pound)
48
40
B
24
0
W
M
R
Long-Run Supply
10
QUANTITY (Thousands of pounds of pistachios)
101
Short-Run Supply
Expert Solution
This question has been solved!
Explore an expertly crafted, step-by-step solution for a thorough understanding of key concepts.

This is a popular solution

Trending nowThis is a popular solution!

Step by stepSolved in 3 steps with 2 images

Knowledge Booster


Learn more about
Need a deep-dive on the concept behind this application? Look no further. Learn more about this topic, economics and related others by exploring similar questions and additional content below.Similar questions
- Suppose Disney+ changes its monthly subscription price from $7 to $9 per month. Graphically show the impact of this price change in the following markets: a. Popcorn, pizza, and other movie snacks Instructions: Drag the supply or demand curve to its new position. b. Netflix Instructions: Drag the supply or demand curve to its new position.arrow_forwardSuppose that Paolo and Sharon are the only suppliers of collectible action figures in a particular market. The following table shows their annual supply schedules: Price Paolo's Quantity Supplied Sharon's Quantity Supplied (Dollars per action figure) (Action figures) (Action figures) 10 A-Z 4 8. 18 6. 12 24 8. 14 28 10 16 30 On the following graph, plot Paolo's supply of collectible action figures using the green points (triange symbol). Next, plot Sharon's supply of collectible action figures using the purple points (diamond symbol). Finally, plot the market supply of collectible action figures using the orange points (square symbol). Note: Line segments will automatically connect the points. Remember to plot from left to right. 12 Paolo's Supply 10 Sharon's Supply MacBook Air F12 F11 F10 F9 FB F7 F6 吕0 F5 O00 F4 F3 * delete &arrow_forwardUse grapharrow_forward
- Use a supply and demand graph to show the impact of the following on the equilibrium price and quantity in the market for Texas Instrument calculators. [You will upload your graphs at the end.] Casio calculators announces higher prices for consumers and at the same time Texas Instrument negotiates a much lower monthly rent on their lease.arrow_forwardI recently stumbled upon the following quote in a newspaper: "Increased production (i.e. an increase in supply) leads to a lower price; which in turn, increases demand." Do you agree with such reasoning? Briefly explain.arrow_forwardWhat are some general factors that can impact the demand for a product and the supply of a product? Identify at least two factors for each and explain the different ways these determinants can shift supply and demand either left or right.arrow_forward
- Draw a supply and demand diagramshowing the impact of each of the following events on equilibrium price and quantity in the market for paint. Briefly explain your reasoning. There have recently been some important cost-saving inventions in the paint-making industry. Hailstorms damaged several factories that make paint, forcing them to close down for several months. There have recently been some important cost-saving inventions in the paint-making industry, and, because of severe hailstorms, many people need to repaint now.arrow_forwardOffice 365 << < CENGAGE MINDTAP e-Services - Home -... Homework: Chapter 03 Back to Assignment Attempts 6. Shifts in supply or demand I YouTube Keep the Highest / 1 PRICE (Dollars per donut) QUANTITY (Donuts) Q Search M Gmail The following graph shows the market for donuts in Detroit, where there are over a thousand donut shops at any given moment. Suppose the Surgeon General issues a public statement saying that consuming donuts is bad for your health. Supply Show the effect of this change on the market for donuts by shifting one or both of the curves on the following graph, holding all else constant. Demand -O Maps Demand 398032670003&eISBN=9780357720677&id=1865330432&snapshot Supply H Hennepin Technical... L eservices and How to program la... Grade It Now Save & Continue Continue without saving F7 PrtScn F8 Hoarrow_forwardDraw a supply and demand diagram for the following event showing the impact of the following event on equilibrium price and quanitity in the market for paint: There have recently been some important cost-saving inventions in the paint-making industry, and, because of severe hailstorms, many people need to repaint now. Breifly explain your reasoningarrow_forward
- In the graph, a decrease in the price of the item will cause the movement from (select all that apply): Price Old supply New supply H K Quantity point M to point G point G to point L point M to point K point J to point M point L to point K point H to point Garrow_forwardDraw a supply and demand diagramshowing the impact of each of the following events on equilibrium price and quantity in the market for paint. Briefly explain your reasoning. There have recently been some important cost-saving inventions in the paint-making industry. Hailstorms damaged several factories that make paint, forcing them to close down for several months. There have recently been some important cost-saving inventions in the paint-making industry, and, because of severe hailstorms, many people need to repaint now.arrow_forwardWhich of the following would NOT shift the supply curve of laptops to the right: *A.an advancement in the technology used in manufacturing laptopB.manufacturers’ expectations of lower watch prices in the futureC.an increase in the price of laptopD.a decrease in the wages/salaries of workers employed to manufacture laptopsarrow_forward
arrow_back_ios
SEE MORE QUESTIONS
arrow_forward_ios
Recommended textbooks for you
 Principles of Economics (12th Edition)EconomicsISBN:9780134078779Author:Karl E. Case, Ray C. Fair, Sharon E. OsterPublisher:PEARSON
 Engineering Economy (17th Edition)EconomicsISBN:9780134870069Author:William G. Sullivan, Elin M. Wicks, C. Patrick KoellingPublisher:PEARSON
 Principles of Economics (MindTap Course List)EconomicsISBN:9781305585126Author:N. Gregory MankiwPublisher:Cengage Learning
 Managerial Economics: A Problem Solving ApproachEconomicsISBN:9781337106665Author:Luke M. Froeb, Brian T. McCann, Michael R. Ward, Mike ShorPublisher:Cengage Learning
 Managerial Economics & Business Strategy (Mcgraw-...EconomicsISBN:9781259290619Author:Michael Baye, Jeff PrincePublisher:McGraw-Hill Education
Principles of Economics (12th Edition)
Economics
ISBN:9780134078779
Author:Karl E. Case, Ray C. Fair, Sharon E. Oster
Publisher:PEARSON
Engineering Economy (17th Edition)
Economics
ISBN:9780134870069
Author:William G. Sullivan, Elin M. Wicks, C. Patrick Koelling
Publisher:PEARSON
Principles of Economics (MindTap Course List)
Economics
ISBN:9781305585126
Author:N. Gregory Mankiw
Publisher:Cengage Learning
Managerial Economics: A Problem Solving Approach
Economics
ISBN:9781337106665
Author:Luke M. Froeb, Brian T. McCann, Michael R. Ward, Mike Shor
Publisher:Cengage Learning
Managerial Economics & Business Strategy (Mcgraw-...
Economics
ISBN:9781259290619
Author:Michael Baye, Jeff Prince
Publisher:McGraw-Hill Education