The following graph shows the supply of and demand for capital in a market over the last year. You can see that the demand for capital has increased over the last year (the demand curve shifted to the right). Place the black X at the equilibrium interest rate and the quantity of capital. INTEREST RATE, r (%) 20 18 16 14 12 ON 10 8 6 4 2 0 S D₁ 2 D₂ 4 6 8 10 12 14 16 18 20 CAPITAL (Billions of dollars) Equilibrium --X I Clear All The market interest rate increased by 2.0%, and the amount of capital borrowed by billion.
The following graph shows the supply of and demand for capital in a market over the last year. You can see that the demand for capital has increased over the last year (the demand curve shifted to the right). Place the black X at the equilibrium interest rate and the quantity of capital. INTEREST RATE, r (%) 20 18 16 14 12 ON 10 8 6 4 2 0 S D₁ 2 D₂ 4 6 8 10 12 14 16 18 20 CAPITAL (Billions of dollars) Equilibrium --X I Clear All The market interest rate increased by 2.0%, and the amount of capital borrowed by billion.

Chapter17: Capital And Time
Section: Chapter Questions
Problem 17.2P

Related questions
Question
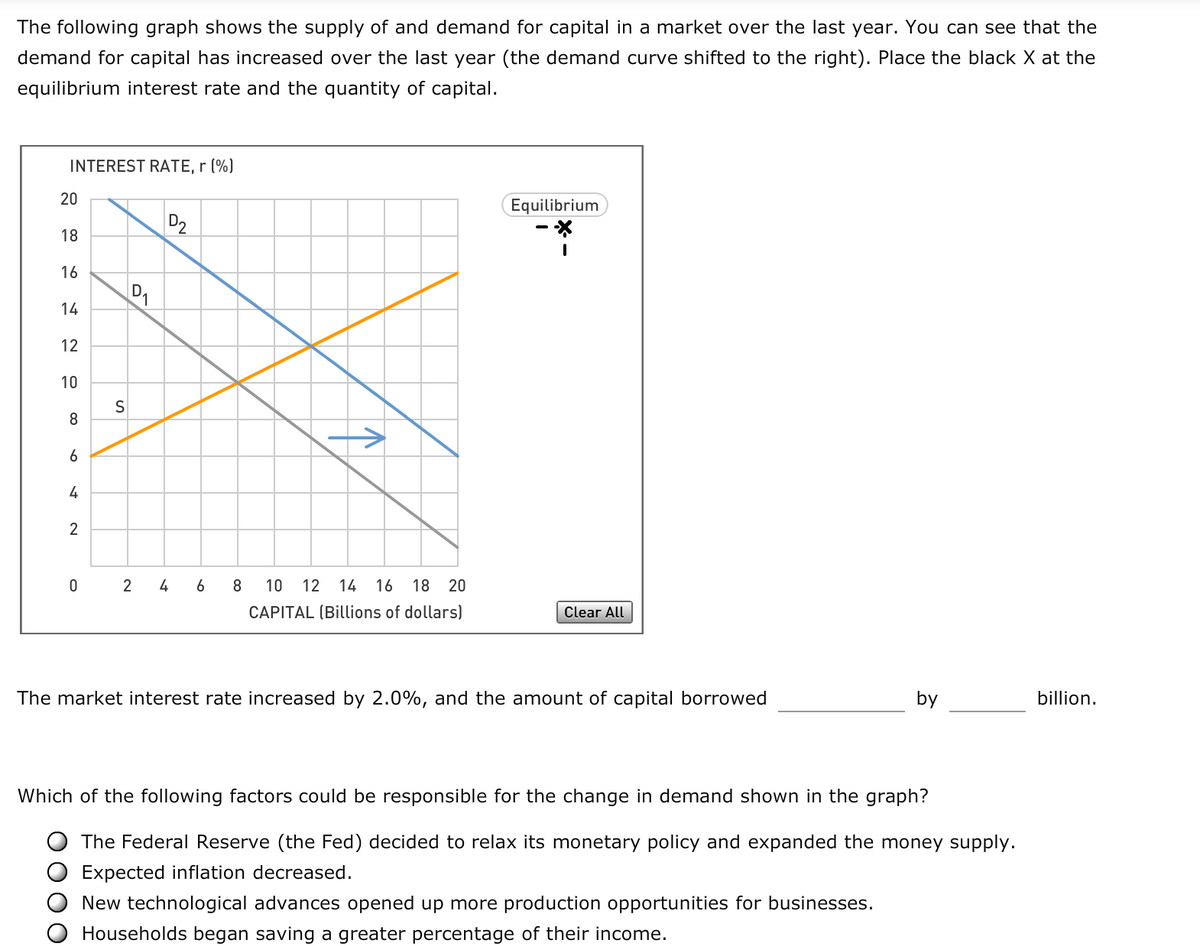
Transcribed Image Text:The following graph shows the supply of and demand for capital in a market over the last year. You can see that the
demand for capital has increased over the last year (the demand curve shifted to the right). Place the black X at the
equilibrium interest rate and the quantity of capital.
INTEREST RATE, r (%)
20
18
16
14
12
10
8
6
4
2
0
S
D₁
D₂
2 4
6
8 10 12 14 16 18 20
CAPITAL (Billions of dollars)
Equilibrium
I
Clear All
The market interest rate increased by 2.0%, and the amount of capital borrowed
by
Which of the following factors could be responsible for the change in demand shown in the graph?
The Federal Reserve (the Fed) decided to relax its monetary policy and expanded the money supply.
Expected inflation decreased.
New technological advances opened up more production opportunities for businesses.
Households began saving a greater percentage of their income.
billion.
Expert Solution
This question has been solved!
Explore an expertly crafted, step-by-step solution for a thorough understanding of key concepts.

This is a popular solution!

Trending now
This is a popular solution!

Step by step
Solved in 3 steps with 1 images

Knowledge Booster


Learn more about
Need a deep-dive on the concept behind this application? Look no further. Learn more about this topic, economics and related others by exploring similar questions and additional content below.Recommended textbooks for you

Principles of Microeconomics
Economics
ISBN:
9781305156050
Author:
N. Gregory Mankiw
Publisher:
Cengage Learning

Principles of Economics, 7th Edition (MindTap Cou…
Economics
ISBN:
9781285165875
Author:
N. Gregory Mankiw
Publisher:
Cengage Learning
Principles of Microeconomics
Economics
ISBN:
9781305156050
Author:
N. Gregory Mankiw
Publisher:
Cengage Learning
Principles of Economics, 7th Edition (MindTap Cou…
Economics
ISBN:
9781285165875
Author:
N. Gregory Mankiw
Publisher:
Cengage Learning

Principles of Economics 2e
Economics
ISBN:
9781947172364
Author:
Steven A. Greenlaw; David Shapiro
Publisher:
OpenStax

Economics: Private and Public Choice (MindTap Cou…
Economics
ISBN:
9781305506725
Author:
James D. Gwartney, Richard L. Stroup, Russell S. Sobel, David A. Macpherson
Publisher:
Cengage Learning

Macroeconomics: Private and Public Choice (MindTa…
Economics
ISBN:
9781305506756
Author:
James D. Gwartney, Richard L. Stroup, Russell S. Sobel, David A. Macpherson
Publisher:
Cengage Learning