The following results are from an independent-measures, two-factor study 5 participants in each treatment condition. Use a two-factor ANOVA with .05 to evaluate the main effects and the interaction. = Source Between Treatments SS 400 df LO 5 MS F
The following results are from an independent-measures, two-factor study 5 participants in each treatment condition. Use a two-factor ANOVA with .05 to evaluate the main effects and the interaction. = Source Between Treatments SS 400 df LO 5 MS F

MATLAB: An Introduction with Applications
6th Edition
ISBN:9781119256830
Author:Amos Gilat
Publisher:Amos Gilat
Chapter1: Starting With Matlab
Section: Chapter Questions
Problem 1P

Related questions
Question
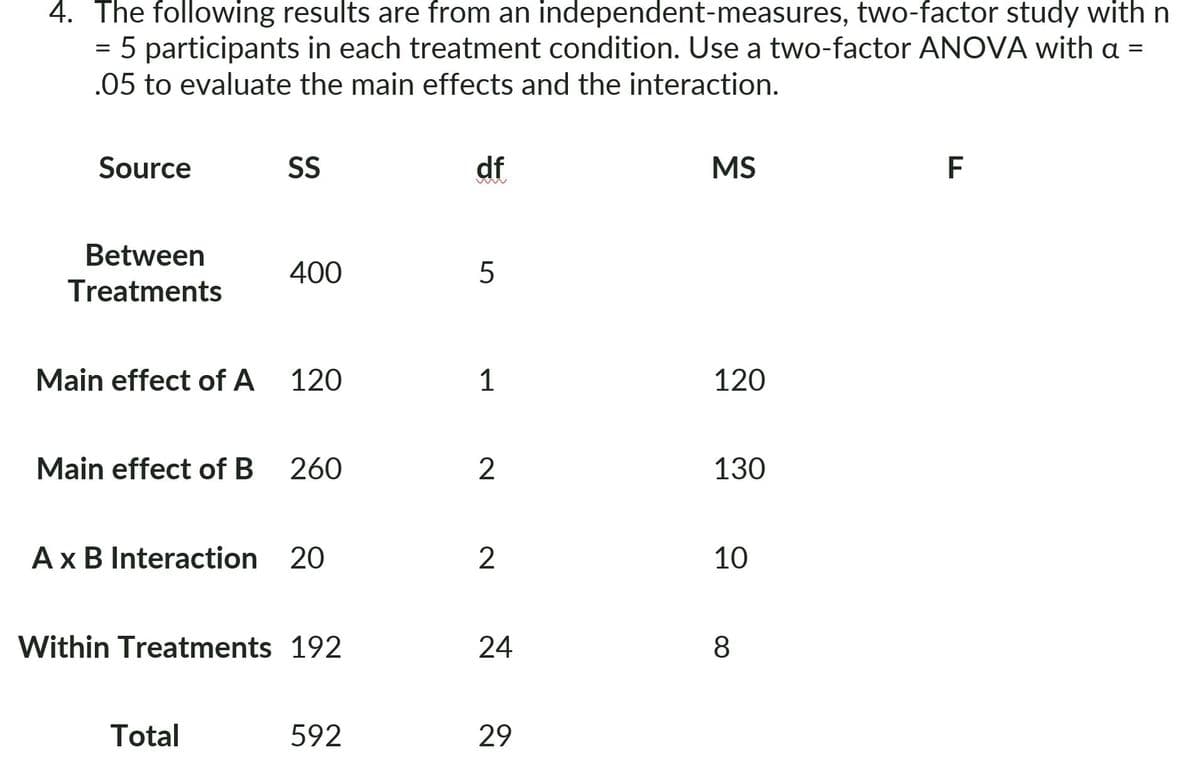
Transcribed Image Text:4. The following results are from an independent-measures, two-factor study with n
5 participants in each treatment condition. Use a two-factor ANOVA with a =
.05 to evaluate the main effects and the interaction.
=
Source
Between
Treatments
Main effect of A
Main effect of B
SS
400
Total
120
260
A x B Interaction 20
Within Treatments 192
592
df
5
1
2
2
24
29
MS
120
130
10
8
F
Expert Solution
This question has been solved!
Explore an expertly crafted, step-by-step solution for a thorough understanding of key concepts.

This is a popular solution!

Trending now
This is a popular solution!

Step by step
Solved in 5 steps

Follow-up Questions
Read through expert solutions to related follow-up questions below.
Follow-up Question
For the null and alternative hypotheses for A and B (there is a main effect due to A/B), they are the same. Why? (There might have been an error here so I'm trying to clear it up).
Solution
Recommended textbooks for you
MATLAB: An Introduction with Applications
Statistics
ISBN:
9781119256830
Author:
Amos Gilat
Publisher:
John Wiley & Sons Inc

Probability and Statistics for Engineering and th…
Statistics
ISBN:
9781305251809
Author:
Jay L. Devore
Publisher:
Cengage Learning

Statistics for The Behavioral Sciences (MindTap C…
Statistics
ISBN:
9781305504912
Author:
Frederick J Gravetter, Larry B. Wallnau
Publisher:
Cengage Learning
MATLAB: An Introduction with Applications
Statistics
ISBN:
9781119256830
Author:
Amos Gilat
Publisher:
John Wiley & Sons Inc
Probability and Statistics for Engineering and th…
Statistics
ISBN:
9781305251809
Author:
Jay L. Devore
Publisher:
Cengage Learning
Statistics for The Behavioral Sciences (MindTap C…
Statistics
ISBN:
9781305504912
Author:
Frederick J Gravetter, Larry B. Wallnau
Publisher:
Cengage Learning

Elementary Statistics: Picturing the World (7th E…
Statistics
ISBN:
9780134683416
Author:
Ron Larson, Betsy Farber
Publisher:
PEARSON

The Basic Practice of Statistics
Statistics
ISBN:
9781319042578
Author:
David S. Moore, William I. Notz, Michael A. Fligner
Publisher:
W. H. Freeman

Introduction to the Practice of Statistics
Statistics
ISBN:
9781319013387
Author:
David S. Moore, George P. McCabe, Bruce A. Craig
Publisher:
W. H. Freeman