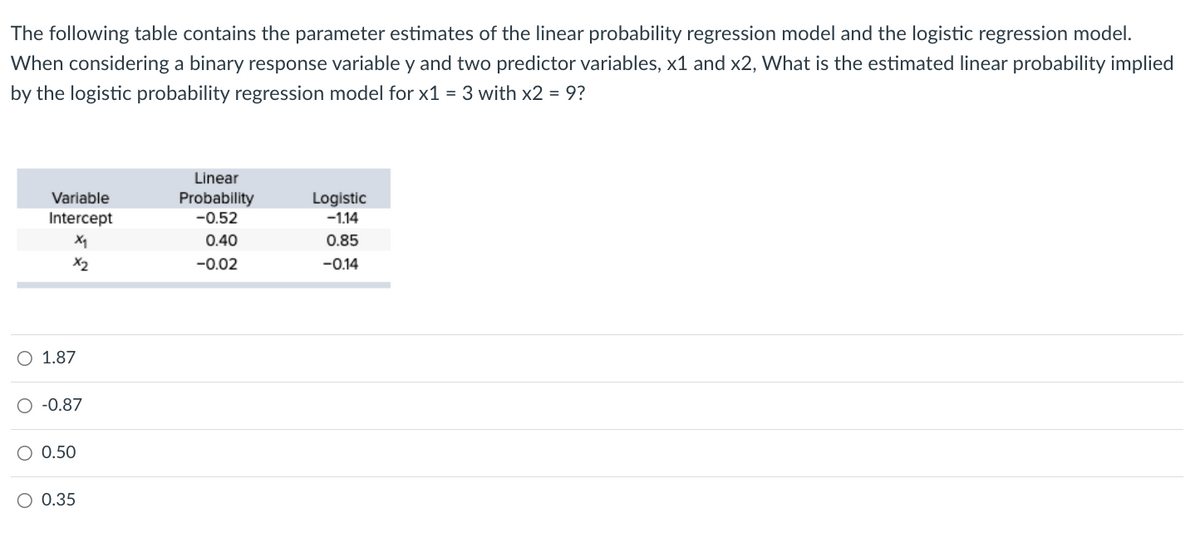
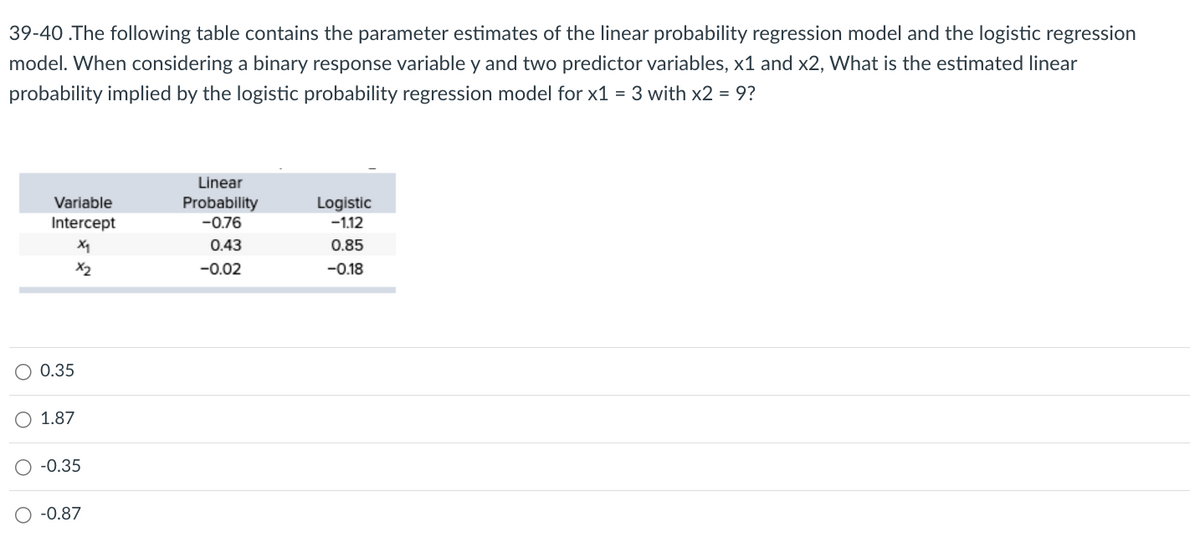
The following table contains the parameter estimates of the linear probability regression model and the logistic regression model. When considering a binary response variable y and two predictor variables, x1 and x2, What is the estimated linear probability implied by the logistic probability regression model for x1 = 3 with x2 = 9? Variable Intercept X₁ x2 O 1.87 O -0.87 O 0.50 O 0.35 Linear Probability -0.52 0.40 -0.02 Logistic -1.14 0.85 -0.14


Q: that Viacom is using? Give examples of Operational Relatedness and Corporate Relatedness to back up…
A: A multi-tiered business plan used by executives to identify, describe and accomplish certain…
Q: You will choose a multinational business enterprise/SME company. and check out its annual reports…
A: ANSWER : 1. The company Adidas was found by Adolf dassler and his senior sibling Rudolf Dassler in…
Q: Discuss two trends in supply chain management. In general, how should companies in a country prepare…
A: In the question, I would discuss the supply chain trends along with the points like how companies…
Q: What is the importance of Quality by Design in Pharmacy
A: Quality by design commonly written as QbD describes a pharmaceutical development approach that helps…
Q: The manager of a branch office of Banco Mexicali observed that during peak hours an average of 15…
A: The assumptions in single-server queue theory include: The waiting line may contain any number of…
Q: What are the pros of total quality management ?
A: Total quality management (TQM) as a term to describe an organization's quality policy and procedure…
Q: You have just been hired as a planner for the municipal school system, and your first assignment is…
A: The objective is to minimize the cost of the meal. Let each food be in terms of 'x', starting with…
Q: tangible and intangib duct attributes are imp re important than inta ct attributos are impo
A: A potential buyer might pick what to buy based on the features that characterize the product—both…
Q: Define project, matrix, and functional organizations. Describe the effects of each structure on…
A: Here, I would describe the three types of organizations, The various components of a company and its…
Q: Supply chain management has enabled some companies to operate more efficiently and compete more…
A: ANSWER : The purpose of Supply Management is to enable a linkage of the progression of merchandise…
Q: 3. (Ch9) A store has collected the following information on one of its products: Demand = 4,500…
A: Given, Annual demand D = 4500 units Number of weeks per year = 52 weeks Daily demand d = 4500/52…
Q: Case 12. FOUR ACES CONSTRUCTION AND HARDWARE SUPPLY: Here, There, and Everywhere In 1964, four girls…
A: Introduction - The case "Four Aces Construction and Hardware supply: Here, There, and Everywhere"…
Q: es" does the Davenport-Harris model identify?
A: Maturity Models Organizations must always evaluate and improve their skills if they want to remain…
Q: Can Amazon Web Services be of assistance to a business?
A: Through the AWS Migration Acceleration Program, AWS assists businesses in operations management by…
Q: What value of Z should be applied? ▼ 1.28? 2.06? 1.04? or 1.65? Part 3 b) How many drives should…
A: Given, Mean m = 50 units Standard deviation s = 5 units Service level = 98%
Q: Girish Shambu and Delores Reisel are teammates at a discount store; their new job is assembling…
A: Ans) Learning Rate = 80% = 0.8 Second unit took = 5hrs b = log(learning rate)/log(2) =…
Q: QUESTION 1 The Brown family owns 420 acres of farmland in North Carolina on which they grow corn and…
A: Let acres of corn produced be x1 and tobacco produced be x2 The objective is to maximize the profit.…
Q: 63.2/ 63 is incorrect...
A: Formulae used: Observations needed= No. of samples needed for element=SD×z h× xbar 2where, h= is…
Q: Voltmeter Ranking Metal Magneto Black Panther Superman Wolverine Iron Man Capt. Marvel Reading 1,…
A: Ans) Formula:
Q: Use the From-To table below to create Activity Relationship Chart. From/To A A ABCDE A X 5 15 0 20…
A: Note: As nothing is mentioned about the figures given, we will assume that A-E are the five…
Q: In quality management, it is a fundamental goal to identify processes that are out of control, to…
A: Quality management refers to the concept of maintaining a high and efficient standard of output in…
Q: Suppose that a process is comprised of 12 components, each having a success rate of 71%. By how much…
A: Given data: Total components = 12 Success rate = 71% or 0.71
Q: Morgan is a training consultant for five mid-sized manufacturing firms. On average, each of their…
A: Given, Number of firms = 5 Arrival = 5 clients every 20 days Service time = 5 days with each client…
Q: Manipulation Manufacturing Company uses 1,000 units of Chip annually in its production. Order costs…
A: EOQ is the economic order quantity that company should purchase to minimise its total inventory cost…
Q: EOQ is 1,500 units based on annual demand of 15,000 units. The ordering cost os P 25 and carrying…
A: Given the data stated below, The annual demand=15000 units The ordering cost applicable for each…
Q: A. What is the critical path for this project network? A-B-C-D-E-F-G-H A-C-F-H…
A: Activity diagram: Possible paths: A-C-F-H A-D-G-H B-E-G-H
Q: Richard Dulski's firm is about to bid on a new radar system. Although the product uses new…
A: Given, Time to build first unit T1= 760 hours Contract units = 13 Learning rate = 85% b =…
Q: In a 3 x 3 transportation problem, let xij be the amount shipped from source i to destination j and…
A: Find the Calculations below:
Q: Top Fashion Ltd uses 7280 meters of fabric each year in its manufacturing processes. Weekly demand…
A: Reorder point is the point at which a company needs to re-stock its inventory. This is determined by…
Q: The amount of time that Ed is going to take for the task at the end of: a) 2nd Day minutes (round…
A: Time taken for 1st day = 7 hrs 42 mins = 7*60+42 = 420+42 = 462 mins Learning rate = 85%
Q: 3) Consider the assignment problem having the following cost table. Assignee A B D a) Formulate the…
A: Part (A): Decision Variable: Suppose-Xij be the decision variable that assignee (1=1,2,3,4)…
Q: Content Audit: Propose the type of content audit you recommend be undertaken as part of the effort…
A: Introduction: Content audit is a very useful and important approach to determine the efficiencies of…
Q: The muffler assembly fabrication cell now averages 18 assemblies per hour and the lead time has been…
A: Given, Container size C = 15 units Safety stock S = 12.5% Average demand D = 18 per hour Lead time L…
Q: The expected times and variances for the project activities are given below, critical path is…
A: Given- Critical path = A→D→F→HDesired project completion time (μ)= 29 periods
Q: a) the 25th exam minutes
A: Learning rate = 80% Time to grade first exam = 12 minutes
Q: A farmer is considering planting live possible crop mixes. The outcomes depend on the weather (dry,…
A: Given- Dry Average Rainy Mix A -1 1 9 Mix B 1 -1 5 Mix C -1 5 4 Mix D 2 2 3 Mix E 5 3…
Q: Suppose you work in a textiles factory. You know that it's normal for machines to print an average…
A: Business operations require some tools and techniques to have an insight into their chances of…
Q: What is the expected profit if 1,600 chairs are made?
A: Given data: Sales price = 15000/1000 = $15 per unitVC = 6000/1000 = $6 per unitFixed Costs = $4000
Q: Benetton family in the 1960s, the company is now one of the largest garment retailers, with stores…
A: The key operational goals of Benetton's retail operations, physical distribution operation, factory,…
Q: find information on major technology project. Then, assign yourself as a project manager for the…
A: The major technology project that I have chosen is development of the new software application for…
Q: Amazon Go was made possible by technologies such as computer vision, sensor fusion, and deep…
A: Since you have posted multiple questions, we will solve the first question for you as per our…
Q: To what extent do the most common error messages differ, and what do they typically indicate?
A: An error message is information displayed when an unforeseen issue occurs, typically on a computer…
Q: Mo. Elaborate on the process of Performance Management explaining its different components
A: Prerequisites, performance planning, performance execution, performance assessment, performance…
Q: The cost-time crashing method relies on choosing the cheapest method for reducing the duration of…
A: Schedule compression strategies, often known as project crashing, are employed when a person wishes…
Q: Question 1 You are given the following information about a wooden crate that is being shipped to by…
A: Given- Rate = $6 pounds w/mWeight = 200 poundsShipment Dimension-L = 30 inW = 40 inH = 36 in
Q: A4. In functional design, we are concerned with the parameters or measures that determine the…
A: Ans) a) Three parameters that determine functional parameters of products are: 1) Reliability 2)…
Q: Double T appliance is a retailer of small appliances in West Texas. Double T gets all of their…
A: Given, Annual demand D = 10000 units Ordering cost S = $100 Carrying cost H = $50 EOQ = 200 units
Q: a) the 10th transplant hours (round your response to two decimal places).
A: Learning rate = 75% Time for first transplant = 27 hours
Q: A4.In functional design, we are concerned with the parameters or measures that determine the…
A: Ans) a) Three generic parameters are : 1) Reliability 2) Maintainability 3) Availability
Q: A simplex tableau is shown below. You should complete the tableau and respond to the questions…
A: Find the given details below: Given details: X1 X2 X3 S1 S2 Basic CB 3 4 5 0 0…


Trending now
This is a popular solution!

Step by step
Solved in 2 steps

- An automobile manufacturer is considering whether to introduce a new model called the Racer. The profitability of the Racer depends on the following factors: The fixed cost of developing the Racer is triangularly distributed with parameters 3, 4, and 5, all in billions. Year 1 sales are normally distributed with mean 200,000 and standard deviation 50,000. Year 2 sales are normally distributed with mean equal to actual year 1 sales and standard deviation 50,000. Year 3 sales are normally distributed with mean equal to actual year 2 sales and standard deviation 50,000. The selling price in year 1 is 25,000. The year 2 selling price will be 1.05[year 1 price + 50 (% diff1)] where % diff1 is the number of percentage points by which actual year 1 sales differ from expected year 1 sales. The 1.05 factor accounts for inflation. For example, if the year 1 sales figure is 180,000, which is 10 percentage points below the expected year 1 sales, then the year 2 price will be 1.05[25,000 + 50( 10)] = 25,725. Similarly, the year 3 price will be 1.05[year 2 price + 50(% diff2)] where % diff2 is the percentage by which actual year 2 sales differ from expected year 2 sales. The variable cost in year 1 is triangularly distributed with parameters 10,000, 12,000, and 15,000, and it is assumed to increase by 5% each year. Your goal is to estimate the NPV of the new car during its first three years. Assume that the company is able to produce exactly as many cars as it can sell. Also, assume that cash flows are discounted at 10%. Simulate 1000 trials to estimate the mean and standard deviation of the NPV for the first three years of sales. Also, determine an interval such that you are 95% certain that the NPV of the Racer during its first three years of operation will be within this interval.Stock market analysts are continually looking for reliable predictors of stock prices. Consider the problem of modeling the price per share of electric utility stocks (Y). Two variables thought to influence this stock price are return on average equity (X1) and annual dividend rate (X2). The stock price, returns on equity, and dividend rates on a randomly selected day for 16 electric utility stocks are provided in the file P13_15.xlsx. Estimate a multiple regression equation using the given data. Interpret each of the estimated regression coefficients. Also, interpret the standard error of estimate and the R-square value for these data.You want to take out a 450,000 loan on a 20-year mortgage with end-of-month payments. The annual rate of interest is 3%. Twenty years from now, you will need to make a 50,000 ending balloon payment. Because you expect your income to increase, you want to structure the loan so at the beginning of each year, your monthly payments increase by 2%. a. Determine the amount of each years monthly payment. You should use a lookup table to look up each years monthly payment and to look up the year based on the month (e.g., month 13 is year 2, etc.). b. Suppose payment each month is to be the same, and there is no balloon payment. Show that the monthly payment you can calculate from your spreadsheet matches the value given by the Excel PMT function PMT(0.03/12,240, 450000,0,0).
- The eTech Company is a fairly recent entry in the electronic device area. The company competes with Apple. Samsung, and other well-known companies in the manufacturing and sales of personal handheld devices. Although eTech recognizes that it is a niche player and will likely remain so in the foreseeable future, it is trying to increase its current small market share in this huge competitive market. Jim Simons, VP of Production, and Catherine Dolans, VP of Marketing, have been discussing the possible addition of a new product to the companys current (rather limited) product line. The tentative name for this new product is ePlayerX. Jim and Catherine agree that the ePlayerX, which will feature a sleeker design and more memory, is necessary to compete successfully with the big boys, but they are also worried that the ePlayerX could cannibalize sales of their existing productsand that it could even detract from their bottom line. They must eventually decide how much to spend to develop and manufacture the ePlayerX and how aggressively to market it. Depending on these decisions, they must forecast demand for the ePlayerX, as well as sales for their existing products. They also realize that Apple. Samsung, and the other big players are not standing still. These competitors could introduce their own new products, which could have very negative effects on demand for the ePlayerX. The expected timeline for the ePlayerX is that development will take no more than a year to complete and that the product will be introduced in the market a year from now. Jim and Catherine are aware that there are lots of decisions to make and lots of uncertainties involved, but they need to start somewhere. To this end. Jim and Catherine have decided to base their decisions on a planning horizon of four years, including the development year. They realize that the personal handheld device market is very fluid, with updates to existing products occurring almost continuously. However, they believe they can include such considerations into their cost, revenue, and demand estimates, and that a four-year planning horizon makes sense. In addition, they have identified the following problem parameters. (In this first pass, all distinctions are binary: low-end or high-end, small-effect or large-effect, and so on.) In the absence of cannibalization, the sales of existing eTech products are expected to produce year I net revenues of 10 million, and the forecast of the annual increase in net revenues is 2%. The ePIayerX will be developed as either a low-end or a high-end product, with corresponding fixed development costs (1.5 million or 2.5 million), variable manufacturing costs ( 100 or 200). and selling prices (150 or 300). The fixed development cost is incurred now, at the beginning of year I, and the variable cost and selling price are assumed to remain constant throughout the planning horizon. The new product will be marketed either mildly aggressively or very aggressively, with corresponding costs. The costs of a mildly aggressive marketing campaign are 1.5 million in year 1 and 0.5 million annually in years 2 to 4. For a very aggressive campaign, these costs increase to 3.5 million and 1.5 million, respectively. (These marketing costs are not part of the variable cost mentioned in the previous bullet; they are separate.) Depending on whether the ePlayerX is a low-end or high-end produce the level of the ePlayerXs cannibalization rate of existing eTech products will be either low (10%) or high (20%). Each cannibalization rate affects only sales of existing products in years 2 to 4, not year I sales. For example, if the cannibalization rate is 10%, then sales of existing products in each of years 2 to 4 will be 10% below their projected values without cannibalization. A base case forecast of demand for the ePlayerX is that in its first year on the market, year 2, demand will be for 100,000 units, and then demand will increase by 5% annually in years 3 and 4. This base forecast is based on a low-end version of the ePlayerX and mildly aggressive marketing. It will be adjusted for a high-end will product, aggressive marketing, and competitor behavior. The adjustments with no competing product appear in Table 2.3. The adjustments with a competing product appear in Table 2.4. Each adjustment is to demand for the ePlayerX in each of years 2 to 4. For example, if the adjustment is 10%, then demand in each of years 2 to 4 will be 10% lower than it would have been in the base case. Demand and units sold are the samethat is, eTech will produce exactly what its customers demand so that no inventory or backorders will occur. Table 2.3 Demand Adjustments When No Competing Product Is Introduced Table 2.4 Demand Adjustments When a Competing Product Is Introduced Because Jim and Catherine are approaching the day when they will be sharing their plans with other company executives, they have asked you to prepare an Excel spreadsheet model that will answer the many what-if questions they expect to be asked. Specifically, they have asked you to do the following: You should enter all of the given data in an inputs section with clear labeling and appropriate number formatting. If you believe that any explanations are required, you can enter them in text boxes or cell comments. In this section and in the rest of the model, all monetary values (other than the variable cost and the selling price) should be expressed in millions of dollars, and all demands for the ePlayerX should be expressed in thousands of units. You should have a scenario section that contains a 0/1 variable for each of the binary options discussed here. For example, one of these should be 0 if the low-end product is chosen and it should be 1 if the high-end product is chosen. You should have a parameters section that contains the values of the various parameters listed in the case, depending on the values of the 0/1 variables in the previous bullet For example, the fixed development cost will be 1.5 million or 2.5 million depending on whether the 0/1 variable in the previous bullet is 0 or 1, and this can be calculated with a simple IF formula. You can decide how to implement the IF logic for the various parameters. You should have a cash flows section that calculates the annual cash flows for the four-year period. These cash flows include the net revenues from existing products, the marketing costs for ePlayerX, and the net revenues for sales of ePlayerX (To calculate these latter values, it will help to have a row for annual units sold of ePlayerX.) The cash flows should also include depreciation on the fixed development cost, calculated on a straight-line four-year basis (that is. 25% of the cost in each of the four years). Then, these annual revenues/costs should be summed for each year to get net cash flow before taxes, taxes should be calculated using a 32% tax rate, and taxes should be subtracted and depreciation should be added back in to get net cash flows after taxes. (The point is that depreciation is first subtracted, because it is not taxed, but then it is added back in after taxes have been calculated.) You should calculate the company's NPV for the four-year horizon using a discount rate of 10%. You can assume that the fixed development cost is incurred now. so that it is not discounted, and that all other costs and revenues are incurred at the ends of the respective years. You should accompany all of this with a line chart with three series: annual net revenues from existing products; annual marketing costs for ePlayerX; and annual net revenues from sales of ePlayerX. Once all of this is completed. Jim and Catherine will have a powerful tool for presentation purposes. By adjusting the 0/1 scenario variables, their audience will be able to see immediately, both numerically and graphically, the financial consequences of various scenarios.Suppose that GLC earns a 2000 profit each time a person buys a car. We want to determine how the expected profit earned from a customer depends on the quality of GLCs cars. We assume a typical customer will purchase 10 cars during her lifetime. She will purchase a car now (year 1) and then purchase a car every five yearsduring year 6, year 11, and so on. For simplicity, we assume that Hundo is GLCs only competitor. We also assume that if the consumer is satisfied with the car she purchases, she will buy her next car from the same company, but if she is not satisfied, she will buy her next car from the other company. Hundo produces cars that satisfy 80% of its customers. Currently, GLC produces cars that also satisfy 80% of its customers. Consider a customer whose first car is a GLC car. If profits are discounted at 10% annually, use simulation to estimate the value of this customer to GLC. Also estimate the value of a customer to GLC if it can raise its customer satisfaction rating to 85%, to 90%, or to 95%. You can interpret the satisfaction value as the probability that a customer will not switch companies.Suppose that a regional express delivery service company wants to estimate the cost of shipping a package (Y) as a function of cargo type, where cargo type includes the following possibilities: fragile, semifragile, and durable. Costs for 15 randomly chosen packages of approximately the same weight and same distance shipped, but of different cargo types, are provided in the file P13_16.xlsx. a. Estimate a regression equation using the given sample data, and interpret the estimated regression coefficients. b. According to the estimated regression equation, which cargo type is the most costly to ship? Which cargo type is the least costly to ship? c. How well does the estimated equation fit the given sample data? How might the fit be improved? d. Given the estimated regression equation, predict the cost of shipping a package with semifragile cargo.
- A company manufacturers a product in the United States and sells it in England. The unit cost of manufacturing is 50. The current exchange rate (dollars per pound) is 1.221. The demand function, which indicates how many units the company can sell in England as a function of price (in pounds) is of the power type, with constant 27556759 and exponent 2.4. a. Develop a model for the companys profit (in dollars) as a function of the price it charges (in pounds). Then use a data table to find the profit-maximizing price to the nearest pound. b. If the exchange rate varies from its current value, does the profit-maximizing price increase or decrease? Does the maximum profit increase or decrease?When you use a RISKSIMTABLE function for a decision variable, such as the order quantity in the Walton model, explain how this provides a fair comparison across the different values tested.Although the normal distribution is a reasonable input distribution in many situations, it does have two potential drawbacks: (1) it allows negative values, even though they may be extremely improbable, and (2) it is a symmetric distribution. Many situations are modelled better with a distribution that allows only positive values and is skewed to the right. Two of these that have been used in many real applications are the gamma and lognormal distributions. @RISK enables you to generate observations from each of these distributions. The @RISK function for the gamma distribution is RISKGAMMA, and it takes two arguments, as in =RISKGAMMA(3,10). The first argument, which must be positive, determines the shape. The smaller it is, the more skewed the distribution is to the right; the larger it is, the more symmetric the distribution is. The second argument determines the scale, in the sense that the product of it and the first argument equals the mean of the distribution. (The mean in this example is 30.) Also, the product of the second argument and the square root of the first argument is the standard deviation of the distribution. (In this example, it is 3(10=17.32.) The @RISK function for the lognormal distribution is RISKLOGNORM. It has two arguments, as in =RISKLOGNORM(40,10). These arguments are the mean and standard deviation of the distribution. Rework Example 10.2 for the following demand distributions. Do the simulated outputs have any different qualitative properties with these skewed distributions than with the triangular distribution used in the example? a. Gamma distribution with parameters 2 and 85 b. Gamma distribution with parameters 5 and 35 c. Lognormal distribution with mean 170 and standard deviation 60
- Regression analysis is a powerful and commonly used tool in business research. One important step in regression is to determine the dependent and independent variable(s). In a bivariate regression, which variable is the dependent variable and which one is the independent variable? What does the intercept of a regression tell? What does the slope of a regression tell? What are some of the main uses of a regression? Provide an example of a situation wherein a bivariate regression would be a good choice for analyzing data. Justify your answers using examples and reasoning.An important application of regression analysis in accounting is in the estimation of cost. By collecting data on volume and cost and using the least squares method to develop an estimated regression equation relating volume and cost, an accountant can estimate the cost associated with a particular manufacturing volume. Consider the following sample of production volumes and total cost data for a manufacturing operation. - Use these data to develop an estimated regression equation that could be used to predict the total cost for a given production volume.- What is the variable cost per unit produced?- Compute the coefficient of determination. What percentage of the variation in total cost can be explained by production volume?- The company’s production schedule shows 500 units must be produced next month. Predict the total cost for this operation.A motion picture industry analyst is studying movies based on epic novels. The following data were obtained for 10 Hollywood movies made in the past five years. Each movie was based on an epic novel. For these data, x1 = first-year box office receipts of the movie, x2 = total production costs of the movie, x3 = total promotional costs of the movie, and x4 = total book sales prior to movie release. All units are in millions of dollars. x1 x2 x3 x4 85.1 8.5 5.1 4.7 106.3 12.9 5.8 8.8 50.2 5.2 2.1 15.1 130.6 10.7 8.4 12.2 54.8 3.1 2.9 10.6 30.3 3.5 1.2 3.5 79.4 9.2 3.7 9.7 91.0 9.0 7.6 5.9 135.4 15.1 7.7 20.8 89.3 10.2 4.5 7.9 a) Suppose Hollywood is planning a new epic movie with projected box office sales x1 = 100 million and production costs x2 = 12 million. The book on which the movie is based had sales of x4 = 9.2 million. Forecast the dollar amount (in millions) that should be budgeted for promotion costs x3 and find an 80% confidence interval for your…