The following table indicates the number of customers per week who bought a smart watch from a sports accessories store, over a random sample of 70 weeks. Number of Customers 0-<10 10-< 20 20-30 30-40 40-50 Number of Weeks 5 18 33 11 3 n = 70 Q.4.1 Calculate the following. All applicable formulae and methods, and the source of all relevant values used, must be indicated: Q.4.1.1 The mean. Interpret your answer. Q.4.1.2 The median. Interpret your answer. Q.4.1.3 The first quartile. Interpret your answer. Q.4.1.4 The standard deviation. (4) (6) (6) Q.4.1.5 What is the coefficient of variation for this data set? OEM (7) (3) Q.4.1.6 Determine the value of the coefficient of skewness using the (4) approximation formulae. Interpret your answer. Q.4.2 The following data set indicates the number of emergency telephone calls received per day by a local police station over a random sample of twenty days: 13 12 16 26 22 32 28 19 29 21 25 27 24 30 25 20 21 31 29 22 Construct a grouped frequency distribution table for this data set. Your table should include columns with descriptive headings, indicating the frequency count values (f) and the percentage frequencies (% f) for each class. The total for each of the latter columns should also be included. Use the classes 10 -< 15; 15 -< 20; and so on.
The following table indicates the number of customers per week who bought a smart watch from a sports accessories store, over a random sample of 70 weeks. Number of Customers 0-<10 10-< 20 20-30 30-40 40-50 Number of Weeks 5 18 33 11 3 n = 70 Q.4.1 Calculate the following. All applicable formulae and methods, and the source of all relevant values used, must be indicated: Q.4.1.1 The mean. Interpret your answer. Q.4.1.2 The median. Interpret your answer. Q.4.1.3 The first quartile. Interpret your answer. Q.4.1.4 The standard deviation. (4) (6) (6) Q.4.1.5 What is the coefficient of variation for this data set? OEM (7) (3) Q.4.1.6 Determine the value of the coefficient of skewness using the (4) approximation formulae. Interpret your answer. Q.4.2 The following data set indicates the number of emergency telephone calls received per day by a local police station over a random sample of twenty days: 13 12 16 26 22 32 28 19 29 21 25 27 24 30 25 20 21 31 29 22 Construct a grouped frequency distribution table for this data set. Your table should include columns with descriptive headings, indicating the frequency count values (f) and the percentage frequencies (% f) for each class. The total for each of the latter columns should also be included. Use the classes 10 -< 15; 15 -< 20; and so on.

Human Heredity: Principles and Issues (MindTap Course List)
11th Edition
ISBN:9781305251052
Author:Michael Cummings
Publisher:Michael Cummings
Chapter3: Transmission Of Genes From Generation To Generation
Section3.7: Mendelian Inheritance In Humans
Problem 2EG: For most cases, a p value of 0.05 is used to determine whether results fit expected values. Is this...

Related questions
Question
Please help urgently thank you
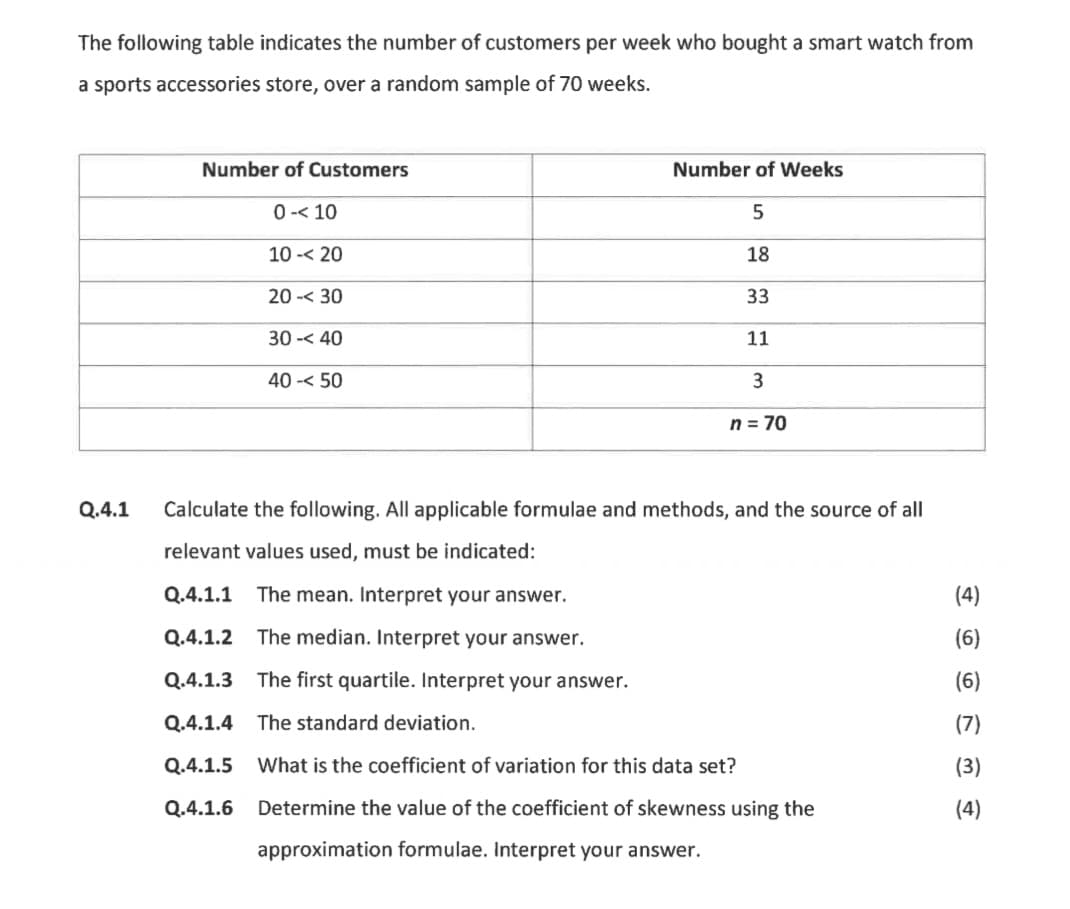
Transcribed Image Text:The following table indicates the number of customers per week who bought a smart watch from
a sports accessories store, over a random sample of 70 weeks.
Number of Customers
0-<10
10-< 20
20-30
30-40
40-50
Number of Weeks
5
18
33
11
3
n = 70
Q.4.1 Calculate the following. All applicable formulae and methods, and the source of all
relevant values used, must be indicated:
Q.4.1.1 The mean. Interpret your answer.
Q.4.1.2 The median. Interpret your answer.
Q.4.1.3 The first quartile. Interpret your answer.
Q.4.1.4 The standard deviation.
(4)
(6)
(6)
Q.4.1.5 What is the coefficient of variation for this data set?
OEM
(7)
(3)
Q.4.1.6
Determine the value of the coefficient of skewness using the
(4)
approximation formulae. Interpret your answer.
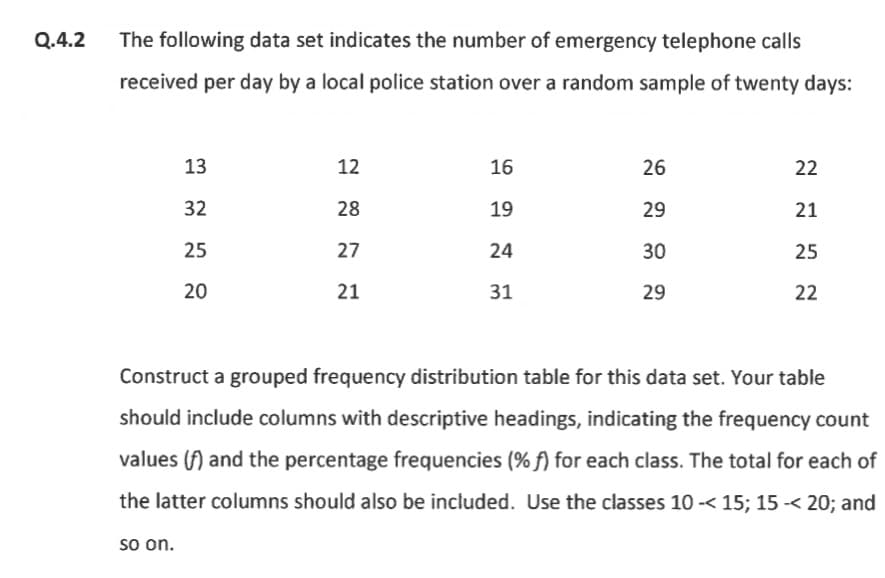
Transcribed Image Text:Q.4.2
The following data set indicates the number of emergency telephone calls
received per day by a local police station over a random sample of twenty days:
13
12
16
26
22
32
28
19
29
21
25
27
24
30
25
20
21
31
29
22
Construct a grouped frequency distribution table for this data set. Your table
should include columns with descriptive headings, indicating the frequency count
values (f) and the percentage frequencies (% f) for each class. The total for each of
the latter columns should also be included. Use the classes 10 -< 15; 15 -< 20; and
so on.
Expert Solution
This question has been solved!
Explore an expertly crafted, step-by-step solution for a thorough understanding of key concepts.

Step by step
Solved in 2 steps

Recommended textbooks for you
Human Heredity: Principles and Issues (MindTap Co…
Biology
ISBN:
9781305251052
Author:
Michael Cummings
Publisher:
Cengage Learning

Case Studies In Health Information Management
Biology
ISBN:
9781337676908
Author:
SCHNERING
Publisher:
Cengage
Human Heredity: Principles and Issues (MindTap Co…
Biology
ISBN:
9781305251052
Author:
Michael Cummings
Publisher:
Cengage Learning
Case Studies In Health Information Management
Biology
ISBN:
9781337676908
Author:
SCHNERING
Publisher:
Cengage
Understanding Health Insurance: A Guide to Billin…
Health & Nutrition
ISBN:
9781337679480
Author:
GREEN
Publisher:
Cengage

Principles Of Radiographic Imaging: An Art And A …
Health & Nutrition
ISBN:
9781337711067
Author:
Richard R. Carlton, Arlene M. Adler, Vesna Balac
Publisher:
Cengage Learning